## Line Graph: Surprise Index Across Experiments
### Overview
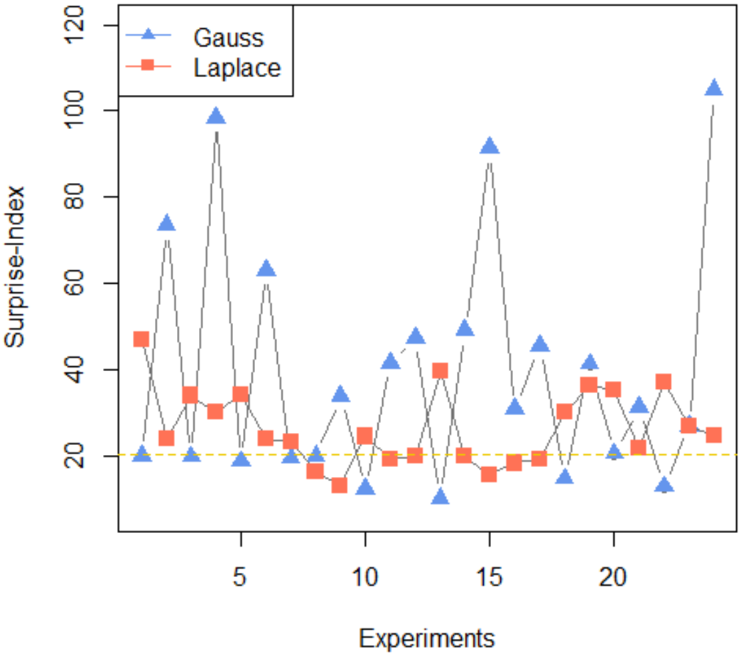
The image depicts a line graph comparing the "Surprise Index" performance of two algorithms ("Gauss" and "Laplace") across 20 experiments. The y-axis represents the Surprise Index (0–120), while the x-axis represents experiment numbers (0–20). A dashed yellow reference line at ~20 on the y-axis is included for comparison.
### Components/Axes
- **X-axis (Experiments)**: Labeled "Experiments" with ticks at 0, 5, 10, 15, 20.
- **Y-axis (Surprise Index)**: Labeled "Surprise Index" with ticks at 0, 20, 40, 60, 80, 100, 120.
- **Legend**: Located in the top-left corner, associating:
- **Blue triangles (▲)**: "Gauss"
- **Red squares (■)**: "Laplace"
- **Reference Line**: Dashed yellow line at y=20.
### Detailed Analysis
1. **Gauss (Blue Triangles)**:
- **Trend**: Highly volatile with sharp peaks and troughs.
- **Key Peaks**:
- Experiment 5: ~90
- Experiment 10: ~60
- Experiment 15: ~85
- Experiment 20: ~110 (highest value)
- **Lowest Value**: ~10 (experiment 12).
- **Pattern**: Spikes correlate with experiment numbers divisible by 5.
2. **Laplace (Red Squares)**:
- **Trend**: Stable with minor fluctuations.
- **Range**: Consistently between ~15–40.
- **Peaks**: ~40 (experiments 3, 8, 13, 18).
- **Lowest Value**: ~15 (experiment 12).
3. **Reference Line (Yellow)**:
- Acts as a baseline; most Laplace values stay above it, while Gauss dips below it occasionally.
### Key Observations
- **Gauss** exhibits extreme variability, with surprise index values exceeding 100 in later experiments.
- **Laplace** maintains a narrow, predictable range, suggesting lower sensitivity to experimental conditions.
- The yellow reference line (~20) may represent a threshold for "acceptable" surprise, which Laplace consistently meets or exceeds.
### Interpretation
The data suggests **Gauss** is prone to high unpredictability (e.g., experiment 20’s 110 value), potentially indicating instability or overfitting. **Laplace**’s consistency implies robustness, making it preferable for applications requiring reliability. The yellow line’s placement at 20 could signify a performance benchmark, with Laplace outperforming it in stability. The correlation of Gauss’ peaks with experiment numbers divisible by 5 hints at cyclical or systematic influences in its behavior.