## Line Chart: Surprise Index vs. Experiments
### Overview
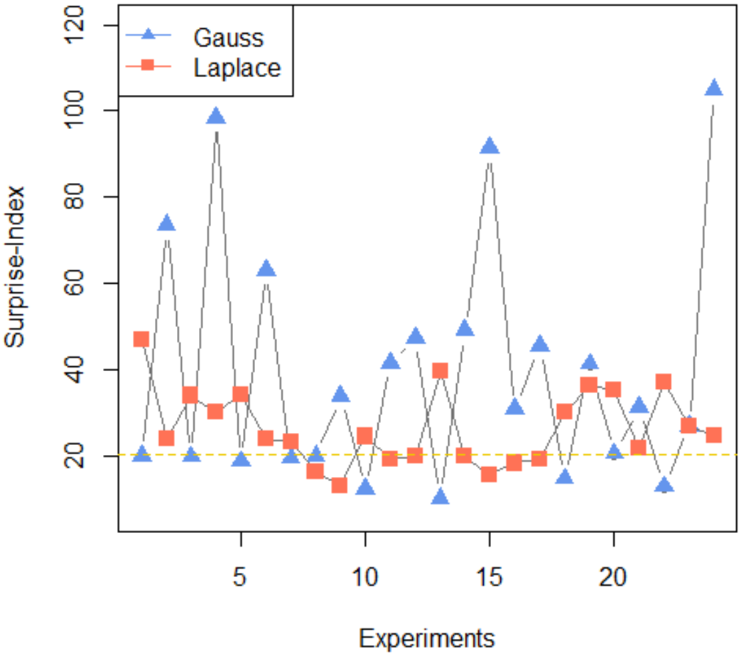
The image is a line chart comparing the "Surprise-Index" of two methods, "Gauss" and "Laplace", across 25 experiments. The chart displays the surprise index values for each experiment, with a horizontal dashed line at Surprise-Index = 20.
### Components/Axes
* **X-axis:** "Experiments", labeled from 1 to 25 in increments of 5.
* **Y-axis:** "Surprise-Index", labeled from 20 to 120 in increments of 20.
* **Legend (top-left):**
* Blue triangle: "Gauss"
* Red square: "Laplace"
* **Horizontal dashed line:** Located at Surprise-Index = 20.
### Detailed Analysis
* **Gauss (Blue Triangles):** The surprise index for Gauss fluctuates significantly across the experiments.
* Experiment 1: ~73
* Experiment 3: ~98
* Experiment 5: ~63
* Experiment 8: ~19
* Experiment 10: ~34
* Experiment 14: ~91
* Experiment 17: ~30
* Experiment 21: ~32
* Experiment 25: ~103
* **Laplace (Red Squares):** The surprise index for Laplace is generally lower and less variable than Gauss.
* Experiment 1: ~47
* Experiment 3: ~33
* Experiment 5: ~34
* Experiment 8: ~23
* Experiment 10: ~13
* Experiment 14: ~17
* Experiment 17: ~19
* Experiment 21: ~37
* Experiment 25: ~24
### Key Observations
* The Gauss method exhibits higher surprise index values and greater variability compared to the Laplace method.
* The Laplace method's surprise index remains relatively stable, generally staying below 40.
* Both methods show some degree of fluctuation, but Gauss has more pronounced peaks and valleys.
* The dashed line at Surprise-Index = 20 appears to be a baseline or threshold.
### Interpretation
The chart suggests that the Gauss method is more sensitive or reactive to changes in the experiments, resulting in a wider range of surprise index values. The Laplace method, on the other hand, appears to be more stable and less prone to extreme fluctuations. The dashed line at 20 could represent a minimum acceptable surprise index, below which the method is considered to be performing poorly. The data indicates that the Laplace method consistently stays above this threshold, while the Gauss method occasionally dips below it.