## Line Chart: Surprise-Index vs. Experiments
### Overview
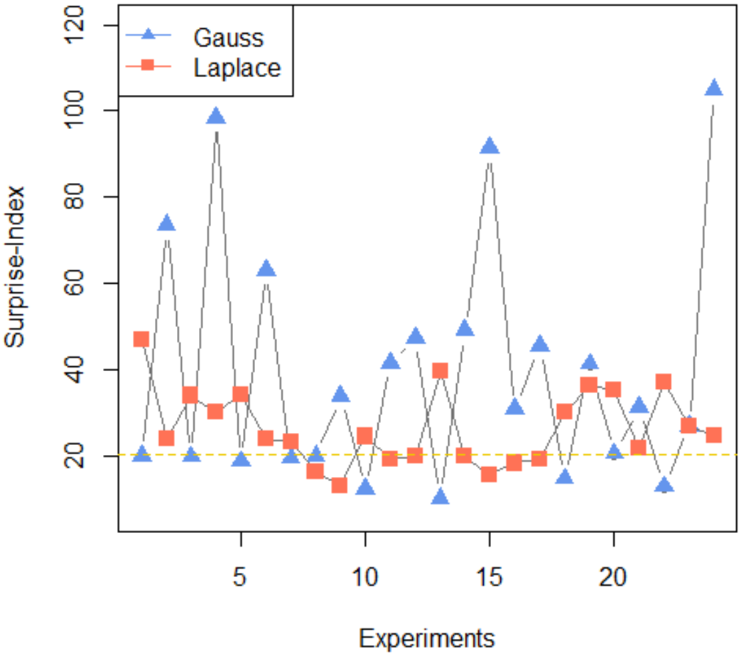
The image presents a line chart comparing the "Surprise-Index" for two distributions, "Gauss" (Gaussian) and "Laplace", across a series of "Experiments". The chart displays the Surprise-Index on the y-axis and the Experiment number on the x-axis. The Gauss distribution exhibits significantly higher and more variable Surprise-Index values compared to the Laplace distribution.
### Components/Axes
* **X-axis:** "Experiments" - ranging from approximately 1 to 23.
* **Y-axis:** "Surprise-Index" - ranging from approximately 0 to 120.
* **Data Series 1:** "Gauss" - represented by blue triangles (▲).
* **Data Series 2:** "Laplace" - represented by red squares (■).
* **Legend:** Located in the top-left corner, clearly labeling each data series with its corresponding symbol and name.
* **Horizontal dashed line:** A horizontal dashed line is present at approximately Surprise-Index = 20.
### Detailed Analysis
**Gauss (Blue Triangles):**
The Gauss line exhibits a highly oscillatory pattern. It starts at approximately 45 at Experiment 1, peaks at approximately 95 at Experiment 3, drops to approximately 15 at Experiment 4, then rises again to approximately 60 at Experiment 5. This pattern of peaks and troughs continues throughout the experiment series.
* Experiment 1: ~45
* Experiment 2: ~60
* Experiment 3: ~95
* Experiment 4: ~15
* Experiment 5: ~60
* Experiment 6: ~40
* Experiment 7: ~20
* Experiment 8: ~40
* Experiment 9: ~50
* Experiment 10: ~25
* Experiment 11: ~45
* Experiment 12: ~30
* Experiment 13: ~20
* Experiment 14: ~30
* Experiment 15: ~85
* Experiment 16: ~40
* Experiment 17: ~40
* Experiment 18: ~30
* Experiment 19: ~40
* Experiment 20: ~25
* Experiment 21: ~15
* Experiment 22: ~30
* Experiment 23: ~105
**Laplace (Red Squares):**
The Laplace line is relatively stable, fluctuating between approximately 20 and 40. It shows less pronounced peaks and troughs compared to the Gauss line.
* Experiment 1: ~30
* Experiment 2: ~35
* Experiment 3: ~30
* Experiment 4: ~20
* Experiment 5: ~35
* Experiment 6: ~30
* Experiment 7: ~25
* Experiment 8: ~30
* Experiment 9: ~35
* Experiment 10: ~25
* Experiment 11: ~30
* Experiment 12: ~30
* Experiment 13: ~20
* Experiment 14: ~25
* Experiment 15: ~35
* Experiment 16: ~30
* Experiment 17: ~30
* Experiment 18: ~30
* Experiment 19: ~35
* Experiment 20: ~25
* Experiment 21: ~20
* Experiment 22: ~30
* Experiment 23: ~35
### Key Observations
* The Gauss distribution consistently exhibits a higher Surprise-Index than the Laplace distribution.
* The Gauss distribution's Surprise-Index fluctuates dramatically, indicating a higher degree of unexpectedness or information content in each experiment.
* The Laplace distribution's Surprise-Index remains relatively stable, suggesting a more predictable outcome across experiments.
* The horizontal dashed line at Surprise-Index = 20 appears to serve as a baseline or threshold, with the Laplace distribution frequently hovering around this value.
### Interpretation
The chart suggests that the Gauss distribution generates more "surprising" outcomes compared to the Laplace distribution within the context of these experiments. The Surprise-Index, in this context, likely measures the degree to which the observed results deviate from expectations based on the respective distributions. The high variability in the Gauss distribution indicates that each experiment yields a relatively unpredictable result, while the Laplace distribution produces more consistent and expected outcomes. The horizontal line could represent a level of surprise considered "normal" or expected, and the Gauss distribution frequently exceeds this level, while the Laplace distribution often remains near or below it. This could imply that the Gauss distribution is better suited for scenarios where novelty or unexpected events are desired, while the Laplace distribution is more appropriate for situations requiring stability and predictability. The final peak in the Gauss distribution at Experiment 23 is particularly notable, suggesting a highly unexpected outcome at the end of the experiment series.