## Scatter Plot: MATH500
### Overview
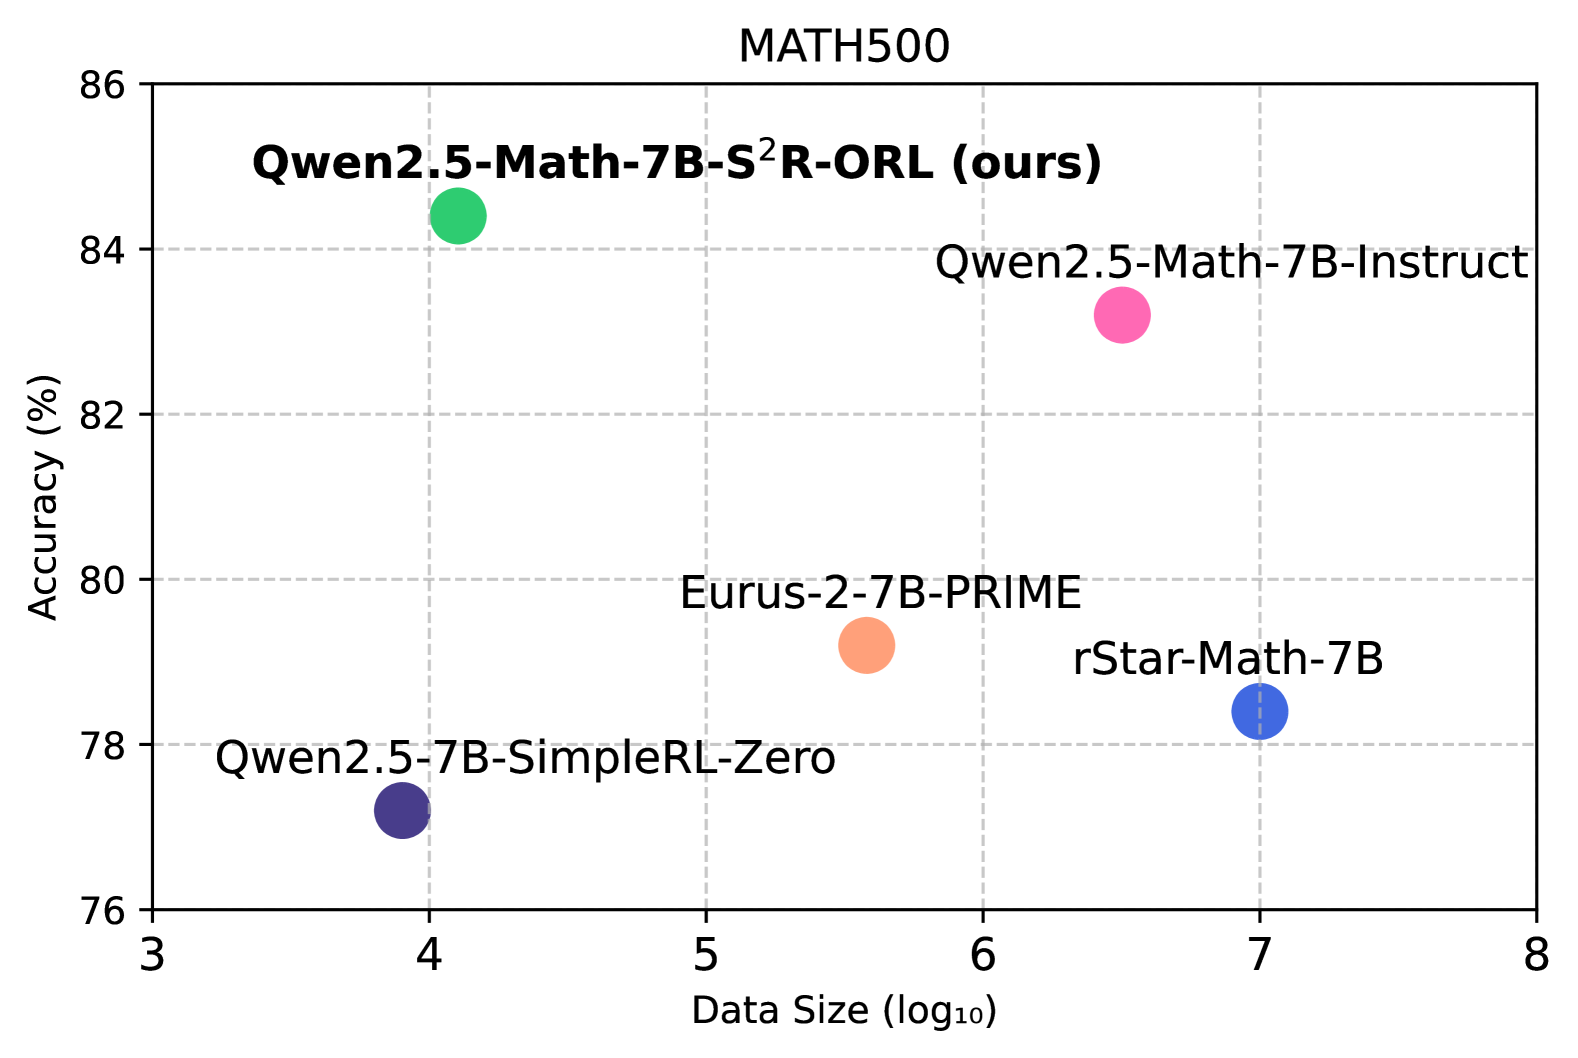
The image is a scatter plot comparing the accuracy (%) of different language models on the MATH500 dataset against their data size (log10). Each model is represented by a colored dot, with its name displayed next to it. The plot shows the relationship between model size and performance.
### Components/Axes
* **Title:** MATH500
* **X-axis:** Data Size (log10), with ticks at 3, 4, 5, 6, 7, and 8.
* **Y-axis:** Accuracy (%), with ticks at 76, 78, 80, 82, 84, and 86.
* **Grid:** The plot has a light gray grid.
* **Data Points (and their approximate coordinates):**
* Qwen2.5-Math-7B-S²R-ORL (ours) (Green): Approximately (4, 84.5)
* Qwen2.5-Math-7B-Instruct (Pink): Approximately (6.3, 83)
* Eurus-2-7B-PRIME (Orange): Approximately (5.5, 79.5)
* rStar-Math-7B (Blue): Approximately (7, 78.5)
* Qwen2.5-7B-SimpleRL-Zero (Indigo): Approximately (3.8, 77.2)
### Detailed Analysis or ### Content Details
The scatter plot displays the performance of five different language models. The x-axis represents the logarithm of the data size used to train the models, while the y-axis represents the accuracy achieved on the MATH500 dataset.
* **Qwen2.5-Math-7B-S²R-ORL (ours):** Located at approximately (4, 84.5), this model has the highest accuracy among the models shown.
* **Qwen2.5-Math-7B-Instruct:** Located at approximately (6.3, 83), this model has a relatively high accuracy.
* **Eurus-2-7B-PRIME:** Located at approximately (5.5, 79.5), this model has a mid-range accuracy.
* **rStar-Math-7B:** Located at approximately (7, 78.5), this model has a lower accuracy compared to the others.
* **Qwen2.5-7B-SimpleRL-Zero:** Located at approximately (3.8, 77.2), this model has the lowest accuracy and smallest data size.
### Key Observations
* The Qwen2.5-Math-7B-S²R-ORL model achieves the highest accuracy with a relatively smaller data size compared to other models.
* The rStar-Math-7B model has a larger data size but lower accuracy compared to the Qwen2.5-Math-7B-Instruct model.
* There is no clear linear correlation between data size and accuracy across all models.
### Interpretation
The scatter plot suggests that model architecture and training methods play a significant role in achieving high accuracy, in addition to the size of the training data. The Qwen2.5-Math-7B-S²R-ORL model demonstrates that high accuracy can be achieved with a smaller data size, possibly due to a more efficient architecture or training process. The plot highlights the importance of factors beyond just data size in determining the performance of language models on the MATH500 dataset.