\n
## Scatter Plot: MATH500 Performance
### Overview
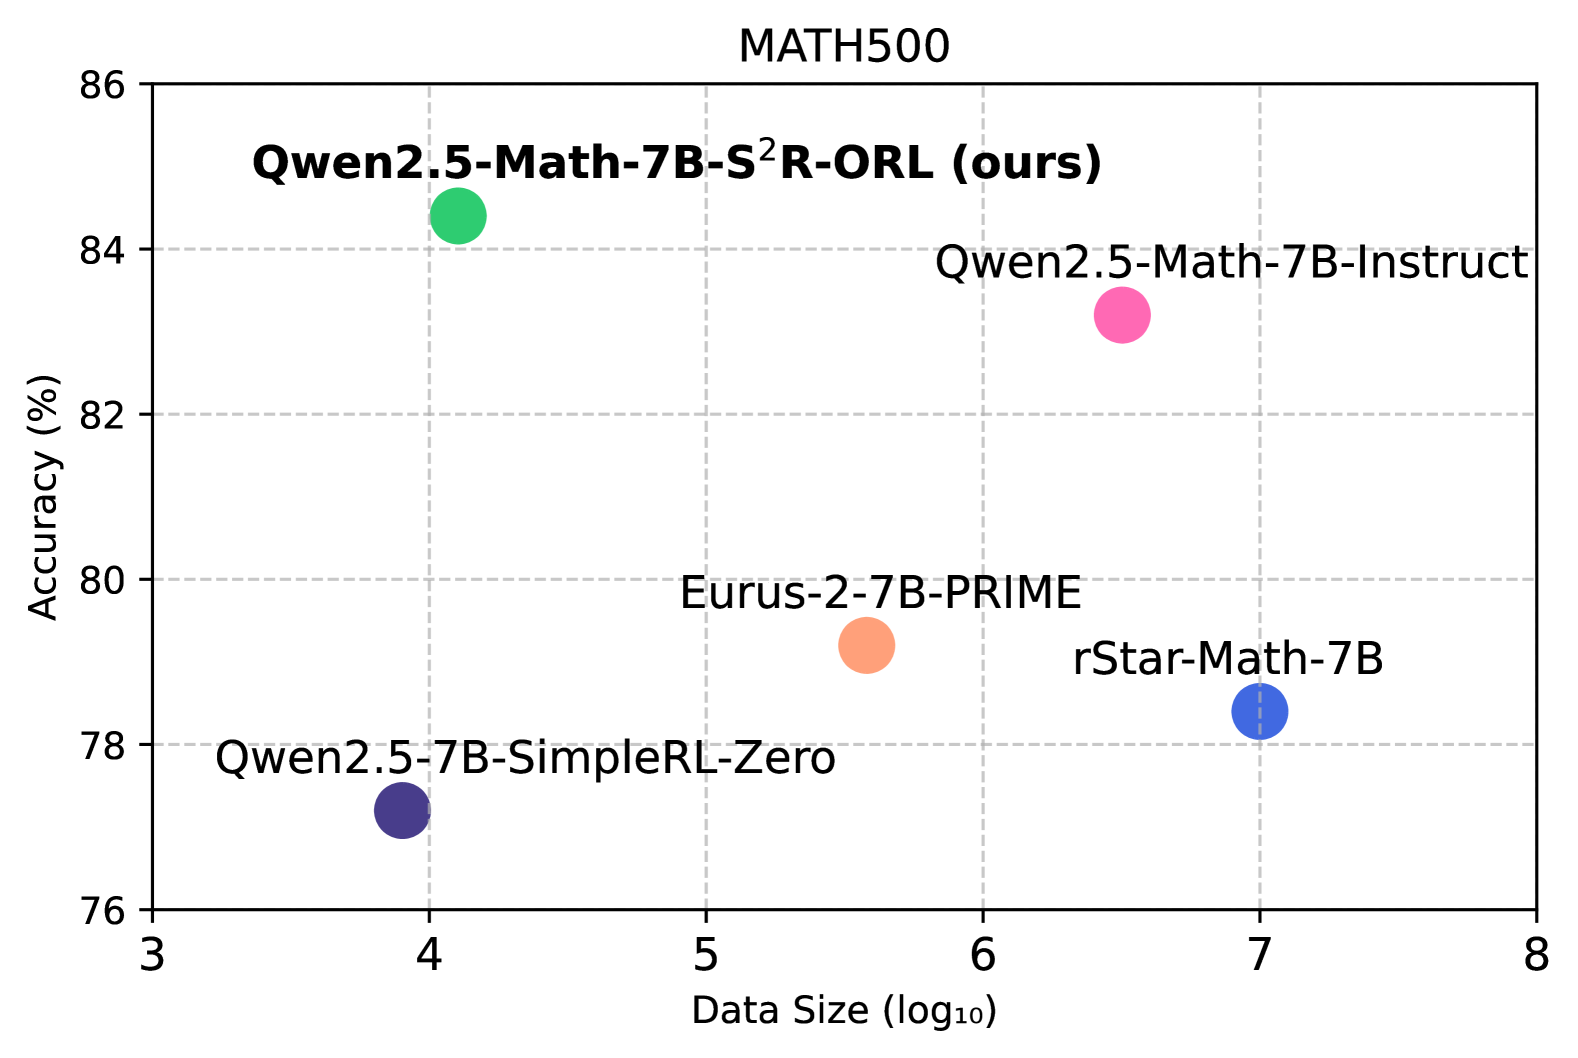
This image presents a scatter plot comparing the performance of several language models on the MATH500 dataset. The plot visualizes the relationship between model accuracy and data size. Each point represents a different model, with its position determined by its accuracy score and the logarithm of the data size used for training.
### Components/Axes
* **Title:** MATH500 (top-center)
* **X-axis:** Data Size (log₁₀) - ranging from approximately 3 to 8.
* **Y-axis:** Accuracy (%) - ranging from approximately 76% to 86%.
* **Data Points:** Representing different models. Each point is labeled with the model name.
* **Gridlines:** Light gray horizontal and vertical lines providing a visual reference.
### Detailed Analysis
The scatter plot displays the following data points:
1. **Qwen2.5-Math-7B-S²R-ORL (ours):** Located at approximately (4.2, 84.5). This model exhibits the highest accuracy among those plotted.
2. **Qwen2.5-Math-7B-Instruct:** Located at approximately (6.5, 84.2). This model has a high accuracy, slightly lower than the previous one.
3. **rStar-Math-7B:** Located at approximately (7.2, 78.5). This model has a lower accuracy compared to the Qwen models.
4. **Eurus-2-7B-PRIME:** Located at approximately (5.2, 80.2). This model's accuracy is between the Qwen models and rStar-Math-7B.
5. **Qwen2.5-7B-SimpleRL-Zero:** Located at approximately (4.0, 77.5). This model has the lowest accuracy among those plotted.
The points are colored as follows:
* Qwen2.5-Math-7B-S²R-ORL (ours): Green
* Qwen2.5-Math-7B-Instruct: Pink
* rStar-Math-7B: Blue
* Eurus-2-7B-PRIME: Black
* Qwen2.5-7B-SimpleRL-Zero: Purple
### Key Observations
* The Qwen2.5-Math-7B-S²R-ORL model demonstrates the highest accuracy on the MATH500 dataset.
* There appears to be a positive correlation between data size and accuracy, although it is not strictly linear. Models trained on larger datasets (higher log₁₀ values) generally exhibit higher accuracy.
* Qwen2.5-Math-7B-S²R-ORL and Qwen2.5-Math-7B-Instruct have similar accuracy, despite different training approaches.
* Qwen2.5-7B-SimpleRL-Zero has the lowest accuracy and a relatively small data size.
### Interpretation
The data suggests that the Qwen2.5-Math-7B-S²R-ORL model is the most effective among those tested on the MATH500 benchmark. The positive correlation between data size and accuracy indicates that increasing the amount of training data generally improves model performance. The close performance of Qwen2.5-Math-7B-S²R-ORL and Qwen2.5-Math-7B-Instruct suggests that the specific training methodology (S²R-ORL vs. Instruct) has a relatively small impact on accuracy when the underlying model architecture and size are the same. The lower performance of Qwen2.5-7B-SimpleRL-Zero could be attributed to its smaller training dataset or a less effective training strategy. The plot provides a comparative analysis of different language models, highlighting their strengths and weaknesses in solving mathematical problems. The "ours" label on the highest performing model suggests this is a new model being presented by the authors of the plot.