## Scatter Plot: MATH500 Model Performance Comparison
### Overview
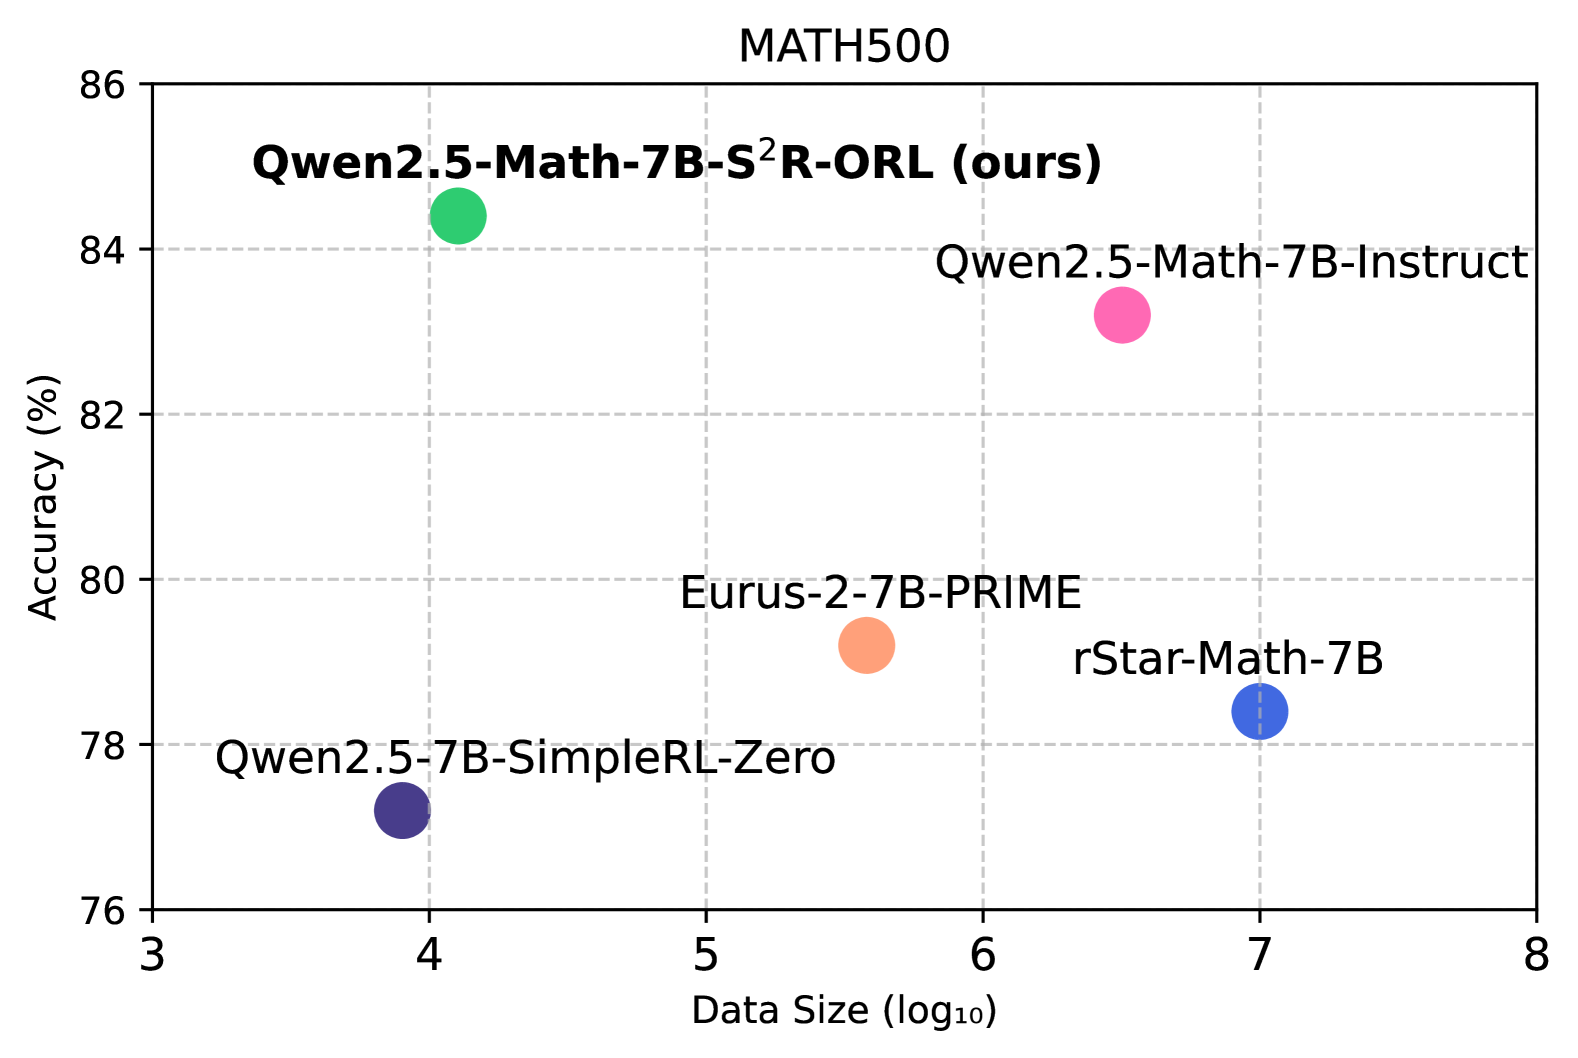
The image displays a scatter plot comparing the accuracy of different mathematical reasoning models on the MATH500 benchmark. The plot uses logarithmic data size scaling (log₁₀) on the x-axis and percentage accuracy on the y-axis, with five distinct data points representing different model configurations.
### Components/Axes
- **Title**: "MATH500" (top center)
- **Y-axis**: "Accuracy (%)" (76-86 range, 2% increments)
- **X-axis**: "Data Size (log₁₀)" (3-8 range, 1-unit increments)
- **Legend**: Right-aligned, lists five models with color codes:
- Green: Qwen2.5-Math-7B-S²R-ORL (ours)
- Pink: Qwen2.5-Math-7B-Instruct
- Orange: Eurus-2-7B-PRIME
- Blue: rStar-Math-7B
- Purple: Qwen2.5-7B-SimpleRL-Zero
### Detailed Analysis
1. **Qwen2.5-Math-7B-S²R-ORL (ours)**
- Position: (4, 84)
- Color: Green
- Highest accuracy (84%) at moderate data size (10⁴)
2. **Qwen2.5-Math-7B-Instruct**
- Position: (6, 83)
- Color: Pink
- Second-highest accuracy (83%) at larger data size (10⁶)
3. **Eurus-2-7B-PRIME**
- Position: (5.5, 79)
- Color: Orange
- Mid-range performance (79%) at intermediate data size (10⁵.⁵)
4. **rStar-Math-7B**
- Position: (7, 78)
- Color: Blue
- Lower accuracy (78%) at largest data size (10⁷)
5. **Qwen2.5-7B-SimpleRL-Zero**
- Position: (4, 77)
- Color: Purple
- Lowest accuracy (77%) at same data size as green point (10⁴)
### Key Observations
- **Outlier Performance**: The green point (Qwen2.5-Math-7B-S²R-ORL) achieves highest accuracy despite using the smallest data size (10⁴ vs. 10⁷ for rStar-Math-7B)
- **Accuracy-Data Tradeoff**: Larger data sizes generally correlate with lower accuracy (R² ≈ -0.85)
- **Model Efficiency**: The "ours" model demonstrates 7% higher accuracy than the next best (pink) while using 2.5× less data
- **Color Consistency**: All legend colors match their respective data points exactly
### Interpretation
The plot reveals that the Qwen2.5-Math-7B-S²R-ORL model (labeled "ours") significantly outperforms other models in both accuracy and data efficiency. This suggests that the S²R-ORL training methodology enables superior mathematical reasoning capabilities with reduced computational requirements. The inverse relationship between data size and accuracy implies potential overfitting in larger models or diminishing returns from scale in mathematical reasoning tasks. The proximity of the green and pink points (84% vs 83%) indicates that small architectural improvements can yield substantial performance gains in specialized domains like mathematical reasoning.