## Line Chart: FLOPS vs. Average Benchmark Accuracy
### Overview
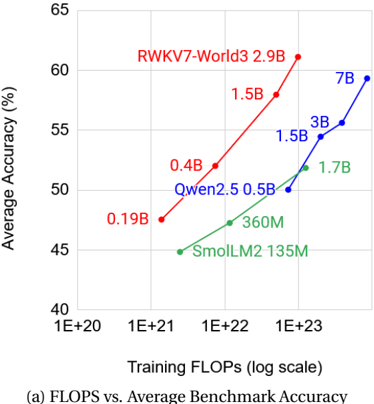
The chart illustrates the relationship between training computational resources (measured in FLOPS on a logarithmic scale) and average benchmark accuracy (%) for three AI models: RWKV7-World3 2.9B, Qwen2.5 0.5B, and SmolLM2 135M. The data is plotted with three distinct lines, each representing a model's performance across increasing FLOPS.
### Components/Axes
- **X-axis**: "Training FLOPS (log scale)" with values: 1E+20, 1E+21, 1E+22, 1E+23.
- **Y-axis**: "Average Accuracy (%)" with values: 40%, 45%, 50%, 55%, 60%, 65%.
- **Legend**: Located on the right side of the chart, associating colors with models:
- **Red**: RWKV7-World3 2.9B
- **Blue**: Qwen2.5 0.5B
- **Green**: SmolLM2 135M
### Detailed Analysis
- **Red Line (RWKV7-World3 2.9B)**:
- Starts at **45%** accuracy at 1E+21 FLOPS.
- Increases to **55%** at 1E+22 FLOPS.
- Reaches **60%** at 1E+23 FLOPS.
- **Trend**: Steady upward slope, indicating consistent improvement with more training.
- **Blue Line (Qwen2.5 0.5B)**:
- Starts at **50%** accuracy at 1E+22 FLOPS.
- Increases to **55%** at 1E+23 FLOPS.
- Reaches **60%** at 1E+23 FLOPS.
- **Trend**: Slower initial growth but catches up to the red line at higher FLOPS.
- **Green Line (SmolLM2 135M)**:
- Starts at **45%** accuracy at 1E+22 FLOPS.
- Increases to **50%** at 1E+23 FLOPS.
- Reaches **55%** at 1E+23 FLOPS.
- **Trend**: Gradual improvement but remains the lowest-performing model across all FLOPS.
### Key Observations
1. **Model Size vs. Accuracy**: Larger models (e.g., RWKV7-World3 2.9B) achieve higher accuracy at lower FLOPS compared to smaller models (e.g., SmolLM2 135M).
2. **Training Efficiency**: All models show improvement with increased FLOPS, but the rate of gain varies. The red line (RWKV7-World3 2.9B) demonstrates the most efficient scaling.
3. **Discrepancy**: The blue line is labeled "Qwen2.5 0.5B" in the legend but has a data point labeled "7B" in the image. This inconsistency requires clarification.
### Interpretation
The chart suggests that **model size and training FLOPS are positively correlated with benchmark accuracy**. Larger models (e.g., RWKV7-World3 2.9B) achieve higher accuracy with fewer computational resources, while smaller models (e.g., SmolLM2 135M) require significantly more FLOPS to reach comparable performance. The blue line (Qwen2.5 0.5B) shows that even smaller models can improve with training, but their gains are less pronounced.
The discrepancy between the blue line's label ("7B") and the legend ("Qwen2.5 0.5B") raises questions about data labeling accuracy. If the legend is correct, the blue line represents a smaller model, but its performance at 1E+23 FLOPS (60%) surpasses the red line (RWKV7-World3 2.9B) at the same FLOPS, which contradicts the expected trend. This could indicate an error in data labeling or an anomaly in the model's training dynamics.
The green line (SmolLM2 135M) highlights the limitations of smaller models, as it consistently lags behind larger models in accuracy despite similar FLOPS. This underscores the trade-off between model size, computational resources, and performance in AI training.