## Bar Charts: SSI Comparison of Different Algorithms on Various Datasets
### Overview
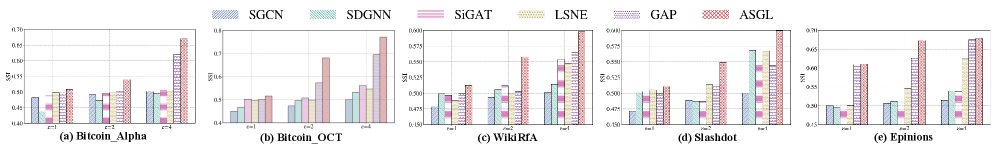
The image contains five bar charts comparing the SSI (likely a similarity score) achieved by different graph neural network algorithms on five different datasets: Bitcoin_Alpha, Bitcoin_OCT, WikiRfA, Slashdot, and Epinions. Each chart shows the SSI values for different algorithms (SGCN, SDGNN, SiGAT, LSNE, GAP, and ASGL) at different values of 'c' (c=1, c=2, c=4).
### Components/Axes
* **Legend (Top):**
* SGCN: Blue with dense diagonal lines from top-left to bottom-right
* SDGNN: Light green with sparse diagonal lines from top-left to bottom-right
* SiGAT: Light pink with horizontal lines
* LSNE: Light yellow with dots
* GAP: Purple with dense diagonal lines from top-right to bottom-left
* ASGL: Red with sparse diagonal lines from top-right to bottom-left
* **Y-axis:** SSI (Similarity Score Index). The scale varies between charts.
* (a) Bitcoin\_Alpha: 0.40 to 0.70
* (b) Bitcoin\_OCT: 0.40 to 0.80
* (c) WikiRfA: 0.450 to 0.600
* (d) Slashdot: 0.450 to 0.600
* (e) Epinions: 0.45 to 0.70
* **X-axis:** 'c' values (c=1, c=2, c=4)
* **Chart Titles:**
* (a) Bitcoin\_Alpha
* (b) Bitcoin\_OCT
* (c) WikiRfA
* (d) Slashdot
* (e) Epinions
### Detailed Analysis
**Chart (a) Bitcoin\_Alpha:**
* **Trend:** Generally, SSI increases as 'c' increases. ASGL consistently has the highest SSI.
* c=1:
* SGCN: ~0.43
* SDGNN: ~0.48
* SiGAT: ~0.45
* LSNE: ~0.49
* GAP: ~0.48
* ASGL: ~0.50
* c=2:
* SGCN: ~0.44
* SDGNN: ~0.49
* SiGAT: ~0.46
* LSNE: ~0.50
* GAP: ~0.49
* ASGL: ~0.51
* c=4:
* SGCN: ~0.50
* SDGNN: ~0.54
* SiGAT: ~0.51
* LSNE: ~0.67
* GAP: ~0.65
* ASGL: ~0.69
**Chart (b) Bitcoin\_OCT:**
* **Trend:** SSI generally increases with 'c'. ASGL performs best.
* c=1:
* SGCN: ~0.45
* SDGNN: ~0.50
* SiGAT: ~0.47
* LSNE: ~0.51
* GAP: ~0.50
* ASGL: ~0.52
* c=2:
* SGCN: ~0.46
* SDGNN: ~0.51
* SiGAT: ~0.48
* LSNE: ~0.52
* GAP: ~0.51
* ASGL: ~0.62
* c=4:
* SGCN: ~0.48
* SDGNN: ~0.53
* SiGAT: ~0.50
* LSNE: ~0.68
* GAP: ~0.66
* ASGL: ~0.78
**Chart (c) WikiRfA:**
* **Trend:** SSI increases with 'c'. ASGL and LSNE show the highest values.
* c=1:
* SGCN: ~0.47
* SDGNN: ~0.50
* SiGAT: ~0.49
* LSNE: ~0.50
* GAP: ~0.49
* ASGL: ~0.51
* c=2:
* SGCN: ~0.48
* SDGNN: ~0.51
* SiGAT: ~0.50
* LSNE: ~0.52
* GAP: ~0.51
* ASGL: ~0.55
* c=4:
* SGCN: ~0.49
* SDGNN: ~0.53
* SiGAT: ~0.52
* LSNE: ~0.57
* GAP: ~0.55
* ASGL: ~0.59
**Chart (d) Slashdot:**
* **Trend:** SSI increases with 'c'. ASGL and LSNE perform best.
* c=1:
* SGCN: ~0.47
* SDGNN: ~0.50
* SiGAT: ~0.48
* LSNE: ~0.50
* GAP: ~0.49
* ASGL: ~0.51
* c=2:
* SGCN: ~0.47
* SDGNN: ~0.49
* SiGAT: ~0.48
* LSNE: ~0.51
* GAP: ~0.50
* ASGL: ~0.53
* c=4:
* SGCN: ~0.48
* SDGNN: ~0.55
* SiGAT: ~0.53
* LSNE: ~0.58
* GAP: ~0.56
* ASGL: ~0.59
**Chart (e) Epinions:**
* **Trend:** SSI increases with 'c'. ASGL and LSNE perform best.
* c=1:
* SGCN: ~0.49
* SDGNN: ~0.50
* SiGAT: ~0.48
* LSNE: ~0.50
* GAP: ~0.49
* ASGL: ~0.51
* c=2:
* SGCN: ~0.50
* SDGNN: ~0.51
* SiGAT: ~0.49
* LSNE: ~0.51
* GAP: ~0.50
* ASGL: ~0.61
* c=4:
* SGCN: ~0.51
* SDGNN: ~0.52
* SiGAT: ~0.50
* LSNE: ~0.67
* GAP: ~0.65
* ASGL: ~0.69
### Key Observations
* ASGL consistently achieves high SSI values across all datasets and 'c' values.
* LSNE also performs well, especially at higher 'c' values.
* The SSI generally increases as the value of 'c' increases, suggesting that a larger 'c' value may improve the performance of these algorithms.
* The performance of SGCN and SDGNN is generally lower compared to ASGL and LSNE.
### Interpretation
The charts demonstrate a comparison of different graph neural network algorithms based on their SSI scores on various datasets. The results suggest that ASGL and LSNE are generally more effective in capturing similarity information within these datasets, particularly as the parameter 'c' increases. The parameter 'c' likely represents a neighborhood size or a similar concept, and the increasing SSI with 'c' suggests that considering larger neighborhoods improves the performance of these algorithms. The choice of algorithm and the value of 'c' should be carefully considered based on the specific dataset and application.