# Technical Data Extraction: Performance Comparison of Signed Graph Embedding Models
This document provides a comprehensive extraction of data from a series of five bar charts comparing the performance of various signed graph embedding models across different datasets.
## 1. Global Legend and Metadata
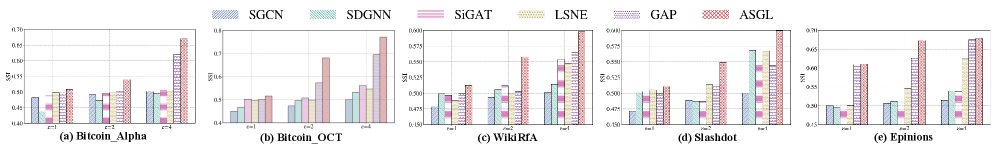
The charts share a common legend located at the top of the image. Each model is represented by a specific color and hatching pattern.
| Model Name | Color/Pattern Description |
| :--- | :--- |
| **SGCN** | Light Blue with diagonal stripes (bottom-left to top-right) |
| **SDGNN** | Light Green with vertical stripes |
| **SiGAT** | Pink with horizontal stripes |
| **LSNE** | Yellow/Gold with dotted pattern |
| **GAP** | Purple with horizontal dashed lines |
| **ASGL** | Red/Brown with cross-hatch (diamond) pattern |
**Common Y-Axis:** SSI (Signed Structural Index)
**Common X-Axis Categories:** $e=1$, $e=2$, $e=4$ (representing different experimental parameters, likely embedding dimensions or edge densities).
---
## 2. Component Analysis by Dataset
### (a) Bitcoin_Alpha
* **Trend:** All models show a general upward trend as $e$ increases. The **ASGL** model (red cross-hatch) consistently outperforms all other models, with its lead widening significantly at $e=4$.
* **Data Points (Approximate SSI):**
* **$e=1$:** Models cluster between 0.43 and 0.51. ASGL is highest (~0.51).
* **$e=2$:** Models cluster between 0.47 and 0.54. ASGL is highest (~0.54).
* **$e=4$:** ASGL shows a sharp increase to ~0.67. GAP is second at ~0.62. Others are near 0.50.
### (b) Bitcoin_OTC
* **Trend:** Similar to Bitcoin_Alpha, there is a positive correlation between $e$ and SSI. **ASGL** maintains a dominant lead across all categories.
* **Data Points (Approximate SSI):**
* **$e=1$:** Range 0.45 to 0.52. ASGL is highest (~0.52).
* **$e=2$:** Range 0.47 to 0.68. ASGL shows a significant jump to ~0.68.
* **$e=4$:** ASGL reaches its peak at ~0.77. GAP follows at ~0.70.
### (c) WikiRfA
* **Trend:** The performance gap between ASGL and other models is more pronounced here. While other models remain relatively flat or show modest gains, **ASGL** scales aggressively.
* **Data Points (Approximate SSI):**
* **$e=1$:** Most models are below 0.50; ASGL is at ~0.51.
* **$e=2$:** ASGL rises to ~0.56.
* **$e=4$:** ASGL reaches ~0.60. GAP and LSNE show moderate improvements to ~0.56 and ~0.55 respectively.
### (d) Slashdot
* **Trend:** This dataset shows the most dramatic performance increase for the **ASGL** model at $e=4$.
* **Data Points (Approximate SSI):**
* **$e=1$:** Models are tightly grouped between 0.47 and 0.51.
* **$e=2$:** ASGL moves to ~0.55.
* **$e=4$:** ASGL reaches ~0.60. Interestingly, SDGNN and LSNE show a significant jump at this stage to ~0.57, outperforming GAP.
### (e) Epinions
* **Trend:** Higher baseline SSI values compared to other datasets. **ASGL** and **GAP** are the top performers, ending nearly equal at $e=4$.
* **Data Points (Approximate SSI):**
* **$e=1$:** Range 0.48 to 0.61. GAP and ASGL are tied for highest (~0.61).
* **$e=2$:** ASGL takes a clear lead at ~0.67.
* **$e=4$:** ASGL and GAP are nearly tied at the highest point of ~0.68. LSNE follows at ~0.63.
---
## 3. Summary of Findings
1. **Top Performer:** The **ASGL** model (red cross-hatch) is the superior model across all five datasets and all tested parameters ($e=1, 2, 4$).
2. **Scalability:** The performance of ASGL improves significantly as the parameter $e$ increases, often showing a steeper growth curve than baseline models like SGCN or SiGAT.
3. **Secondary Models:** **GAP** (purple) is consistently the second-best performer, particularly on the Bitcoin and Epinions datasets.
4. **Baseline Stability:** Models like **SGCN** and **SDGNN** show the least variance, maintaining relatively stable but lower SSI scores across different values of $e$.