## Bar Charts: Comparative Performance of Six Methods Across Five Datasets
### Overview
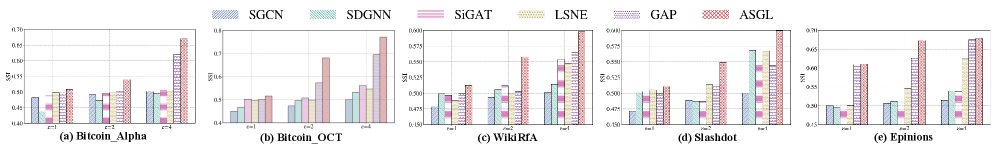
The image displays a series of five bar charts arranged horizontally, comparing the performance of six different methods (SGCN, SDGNN, SiGAT, LSNE, GAP, ASGL) across five distinct datasets. The performance metric is "MRR" (Mean Reciprocal Rank). Each chart corresponds to a different dataset, labeled (a) through (e). A shared legend is positioned at the top center of the entire figure.
### Components/Axes
* **Legend (Top Center):** A horizontal legend defines the six methods with distinct colors and patterns:
* **SGCN:** Blue with diagonal stripes (\\).
* **SDGNN:** Light blue with a dotted pattern.
* **SiGAT:** Pink with horizontal stripes (-).
* **LSNE:** Yellow with diagonal stripes (/).
* **GAP:** Purple with vertical stripes (|).
* **ASGL:** Red with a crosshatch pattern (+).
* **Chart Titles (Bottom of each subplot):**
* (a) Bitcoin_Alpha
* (b) Bitcoin_OCT
* (c) WikiRF
* (d) Slashdot
* (e) Epinions
* **X-Axis (Common to all charts):** Labeled with three categories: "Top 1", "Top 2", and "Top 3".
* **Y-Axis (Common label, varying scales):** Labeled "MRR". The scale ranges differ per chart to accommodate the data range.
* (a) Bitcoin_Alpha: ~0.40 to 0.70
* (b) Bitcoin_OCT: ~0.40 to 0.80
* (c) WikiRF: ~0.450 to 0.600
* (d) Slashdot: ~0.450 to 0.600
* (e) Epinions: ~0.35 to 0.70
### Detailed Analysis
**Chart (a) Bitcoin_Alpha:**
* **Trend:** For all methods, MRR increases from "Top 1" to "Top 3". ASGL shows the most significant increase.
* **Approximate Values (MRR):**
* **Top 1:** SGCN (~0.47), SDGNN (~0.48), SiGAT (~0.49), LSNE (~0.50), GAP (~0.49), ASGL (~0.50).
* **Top 2:** SGCN (~0.48), SDGNN (~0.49), SiGAT (~0.50), LSNE (~0.51), GAP (~0.50), ASGL (~0.53).
* **Top 3:** SGCN (~0.49), SDGNN (~0.50), SiGAT (~0.51), LSNE (~0.52), GAP (~0.65), ASGL (~0.66).
**Chart (b) Bitcoin_OCT:**
* **Trend:** MRR increases from "Top 1" to "Top 3" for all methods. ASGL and GAP show a very sharp increase at "Top 3".
* **Approximate Values (MRR):**
* **Top 1:** SGCN (~0.44), SDGNN (~0.46), SiGAT (~0.48), LSNE (~0.49), GAP (~0.48), ASGL (~0.49).
* **Top 2:** SGCN (~0.45), SDGNN (~0.47), SiGAT (~0.49), LSNE (~0.50), GAP (~0.58), ASGL (~0.68).
* **Top 3:** SGCN (~0.46), SDGNN (~0.48), SiGAT (~0.50), LSNE (~0.51), GAP (~0.75), ASGL (~0.78).
**Chart (c) WikiRF:**
* **Trend:** MRR generally increases from "Top 1" to "Top 3". ASGL consistently outperforms others, with a notable jump at "Top 3".
* **Approximate Values (MRR):**
* **Top 1:** SGCN (~0.490), SDGNN (~0.500), SiGAT (~0.505), LSNE (~0.510), GAP (~0.505), ASGL (~0.530).
* **Top 2:** SGCN (~0.495), SDGNN (~0.510), SiGAT (~0.515), LSNE (~0.520), GAP (~0.550), ASGL (~0.560).
* **Top 3:** SGCN (~0.500), SDGNN (~0.520), SiGAT (~0.525), LSNE (~0.530), GAP (~0.580), ASGL (~0.600).
**Chart (d) Slashdot:**
* **Trend:** MRR increases from "Top 1" to "Top 3". ASGL and GAP show the strongest performance, especially at "Top 3".
* **Approximate Values (MRR):**
* **Top 1:** SGCN (~0.470), SDGNN (~0.480), SiGAT (~0.485), LSNE (~0.490), GAP (~0.485), ASGL (~0.500).
* **Top 2:** SGCN (~0.475), SDGNN (~0.490), SiGAT (~0.495), LSNE (~0.500), GAP (~0.540), ASGL (~0.550).
* **Top 3:** SGCN (~0.480), SDGNN (~0.500), SiGAT (~0.505), LSNE (~0.510), GAP (~0.570), ASGL (~0.590).
**Chart (e) Epinions:**
* **Trend:** MRR increases from "Top 1" to "Top 3". ASGL and GAP are the top performers, with a very large increase at "Top 3".
* **Approximate Values (MRR):**
* **Top 1:** SGCN (~0.38), SDGNN (~0.39), SiGAT (~0.40), LSNE (~0.41), GAP (~0.40), ASGL (~0.50).
* **Top 2:** SGCN (~0.39), SDGNN (~0.40), SiGAT (~0.41), LSNE (~0.42), GAP (~0.58), ASGL (~0.67).
* **Top 3:** SGCN (~0.40), SDGNN (~0.41), SiGAT (~0.42), LSNE (~0.43), GAP (~0.67), ASGL (~0.68).
### Key Observations
1. **Consistent Leader:** The ASGL method (red crosshatch) achieves the highest or ties for the highest MRR in every "Top" category across all five datasets.
2. **Strong Runner-up:** The GAP method (purple vertical stripes) is consistently the second-best performer, often closely following ASGL.
3. **Performance Hierarchy:** A general hierarchy is visible: ASGL ≥ GAP > LSNE ≈ SiGAT ≈ SDGNN > SGCN. SGCN (blue diagonal stripes) is typically the lowest-performing method.
4. **"Top 3" Effect:** The performance gap between methods, particularly between ASGL/GAP and the others, widens significantly in the "Top 3" category for all datasets. This suggests ASGL and GAP are especially effective at ranking correct items within the top three results.
5. **Dataset Variability:** The absolute MRR values vary by dataset (e.g., Bitcoin_OCT shows higher overall MRR than Epinions), but the relative performance pattern of the methods remains remarkably consistent.
### Interpretation
This set of charts provides a comparative benchmark for six graph-based or network embedding methods on link prediction or ranking tasks (as suggested by the "MRR" metric and "Top-k" evaluation). The data strongly suggests that the **ASGL** method is the most effective across diverse network types (cryptocurrency transaction networks like Bitcoin, social networks like Slashdot and Epinions, and an encyclopedia network like WikiRF). Its consistent superiority, especially in the critical "Top 3" ranking, indicates a robust algorithmic advantage.
The parallel performance of **GAP** as a close second implies it may share some effective underlying principles with ASGL. The clustering of the other four methods (SGCN, SDGNN, SiGAT, LSNE) at a lower performance tier suggests they may represent a different, less effective class of approaches for these specific tasks. The widening gap at "Top 3" is particularly noteworthy for applications where high-precision top recommendations are crucial, as it demonstrates that the choice of method (ASGL or GAP) has a much larger impact on user experience or system accuracy in that scenario. The consistency across five distinct datasets argues against these results being dataset-specific anomalies and points toward a generalizable finding about method efficacy.