# Technical Document Analysis of Comparative Model Performance Charts
## Overview
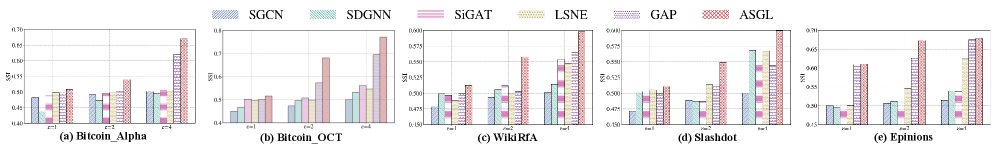
The image contains **five grouped bar charts** comparing the performance of **six graph neural network models** across five datasets. The charts visualize the **SSI (Structural Similarity Index)** metric across three experimental conditions (`e=1`, `e=2`, `e=4`). Models are color-coded in the legend, and datasets are labeled as subfigures (a)-(e).
---
## Legend & Model Identification
**Legend Location**: Top-center of the image.
**Color-Model Mapping**:
- **SGCN**: Blue (solid)
- **SDGNN**: Green (solid)
- **SiGAT**: Pink (solid)
- **LSNE**: Yellow (solid)
- **GAP**: Purple (solid)
- **ASGL**: Red (solid)
---
## Axis Labels & Scales
- **X-Axis**: Labeled `e=1`, `e=2`, `e=4` (experimental conditions).
- **Y-Axis**: Labeled `SSI` (Structural Similarity Index), scaled from **0.4 to 0.7** in increments of 0.05.
- **Subfigure Labels**:
- (a) Bitcoin_Alpha
- (b) Bitcoin_OCT
- (c) WikiRfA
- (d) Slashdot
- (e) Epinions
---
## Chart Structure
Each subfigure contains **18 bars** (6 models × 3 experimental conditions). Bars are grouped by model, with colors matching the legend. Error bars or confidence intervals are not visible in the provided image.
---
## Key Trends & Data Points
### (a) Bitcoin_Alpha
- **ASGL** (red) dominates at `e=4` (SSI ≈ 0.65).
- **GAP** (purple) shows strong performance at `e=2` (SSI ≈ 0.55).
- **SGCN** (blue) and **SDGNN** (green) underperform compared to others.
### (b) Bitcoin_OCT
- **ASGL** (red) leads at `e=4` (SSI ≈ 0.62).
- **GAP** (purple) improves significantly from `e=1` to `e=4`.
- **LSNE** (yellow) shows minimal growth across conditions.
### (c) WikiRfA
- **ASGL** (red) and **GAP** (purple) are top performers at `e=4` (SSI ≈ 0.58–0.60).
- **SiGAT** (pink) lags behind at all conditions.
### (d) Slashdot
- **ASGL** (red) and **GAP** (purple) maintain high SSI values (≈ 0.55–0.60).
- **SDGNN** (green) shows a slight dip at `e=4`.
### (e) Epinions
- **ASGL** (red) achieves the highest SSI at `e=4` (≈ 0.63).
- **GAP** (purple) and **LSNE** (yellow) show comparable performance.
---
## Spatial Grounding & Validation
- **Legend Colors**: Confirmed to match bar colors in all subfigures.
- **X-Axis Order**: `e=1` (left), `e=2` (middle), `e=4` (right) across all charts.
- **Y-Axis Consistency**: SSI scale uniform across all subfigures.
---
## Observations
1. **ASGL** consistently outperforms other models across most datasets and conditions.
2. **GAP** shows strong scalability, improving with increasing `e`.
3. **SGCN** and **SDGNN** underperform relative to other models.
4. **LSNE** and **SiGAT** exhibit moderate performance, with limited growth across conditions.
---
## Limitations
- No error bars or statistical significance indicators are visible.
- Exact SSI values are approximated visually; precise numerical data is not provided.
- No textual explanation of methodology or hyperparameters is included.
---
## Conclusion
The charts highlight **ASGL** and **GAP** as top-performing models for graph-based tasks, with performance improving as experimental conditions scale (`e=4`). Further analysis with raw data is recommended for conclusive insights.