## Bar Chart: RMS Error vs. iSNR for Different Methods
### Overview
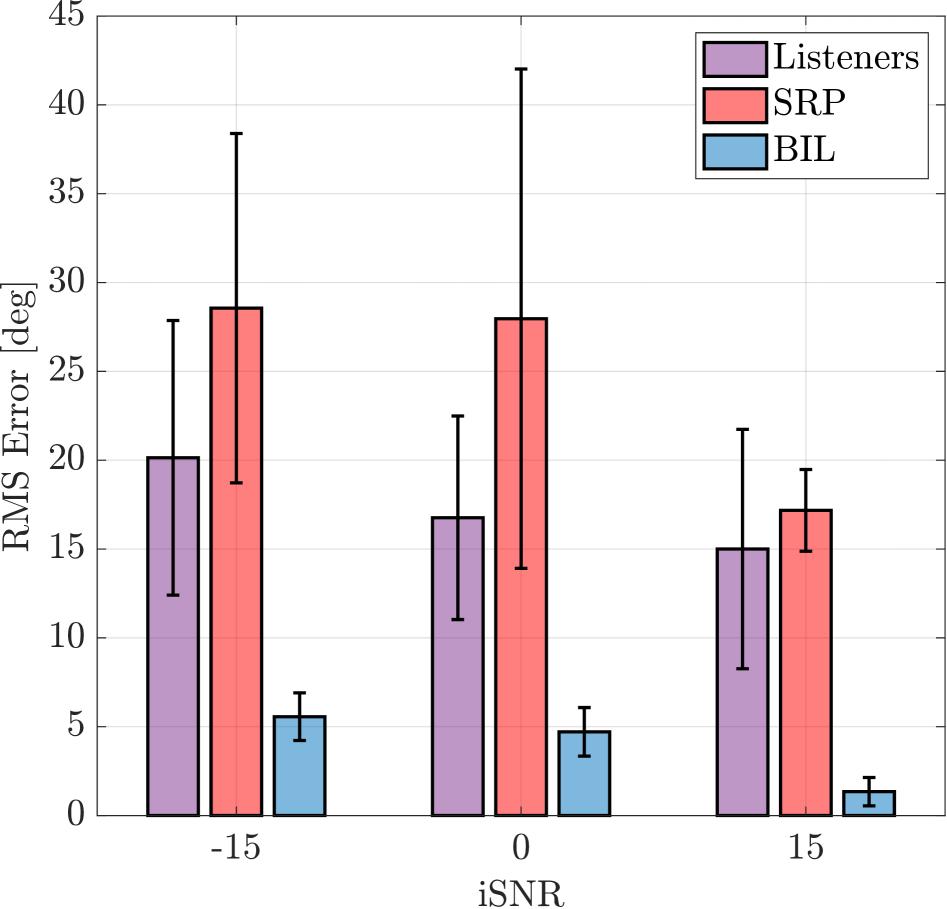
The image is a bar chart comparing the Root Mean Square (RMS) Error in degrees for three different methods (Listeners, SRP, and BIL) across three different iSNR (input Signal-to-Noise Ratio) levels (-15, 0, and 15). The chart displays the mean RMS error as the height of the bars, with error bars indicating the standard deviation.
### Components/Axes
* **Title:** None explicitly provided in the image.
* **Y-axis:** "RMS Error [deg]" with a scale from 0 to 45 in increments of 5.
* **X-axis:** "iSNR" with values -15, 0, and 15.
* **Legend:** Located in the top-right corner, indicating:
* Listeners (Purple)
* SRP (Red)
* BIL (Blue)
### Detailed Analysis
The chart presents RMS Error for three methods at three iSNR levels.
**iSNR = -15:**
* Listeners (Purple): RMS Error is approximately 20 degrees, with an error bar extending from roughly 12 to 28 degrees.
* SRP (Red): RMS Error is approximately 28.5 degrees, with an error bar extending from roughly 18.5 to 38.5 degrees.
* BIL (Blue): RMS Error is approximately 5.5 degrees, with an error bar extending from roughly 3.5 to 7.5 degrees.
**iSNR = 0:**
* Listeners (Purple): RMS Error is approximately 16.5 degrees, with an error bar extending from roughly 8.5 to 24.5 degrees.
* SRP (Red): RMS Error is approximately 28 degrees, with an error bar extending from roughly 14 to 42 degrees.
* BIL (Blue): RMS Error is approximately 4.5 degrees, with an error bar extending from roughly 2.5 to 6.5 degrees.
**iSNR = 15:**
* Listeners (Purple): RMS Error is approximately 15 degrees, with an error bar extending from roughly 7.5 to 22 degrees.
* SRP (Red): RMS Error is approximately 17 degrees, with an error bar extending from roughly 13.5 to 20 degrees.
* BIL (Blue): RMS Error is approximately 1.25 degrees, with an error bar extending from roughly 0.5 to 2 degrees.
### Key Observations
* SRP consistently has the highest RMS error across all iSNR levels.
* BIL consistently has the lowest RMS error across all iSNR levels.
* The RMS error for SRP appears to decrease as iSNR increases from -15 to 15.
* The RMS error for BIL decreases significantly as iSNR increases from -15 to 15.
* The error bars for SRP are generally larger than those for Listeners and BIL, indicating higher variability.
### Interpretation
The chart compares the performance of three different methods (Listeners, SRP, and BIL) in terms of RMS error at different iSNR levels. The data suggests that BIL is the most accurate method, as it consistently has the lowest RMS error. SRP is the least accurate method, with the highest RMS error. The performance of all methods improves (RMS error decreases) as the iSNR increases, which is expected as the signal becomes clearer relative to the noise. The large error bars for SRP suggest that its performance is more variable and less reliable than the other two methods.