## Bar Chart: RMS Error by iSNR for Listeners, SRP, and BIL
### Overview
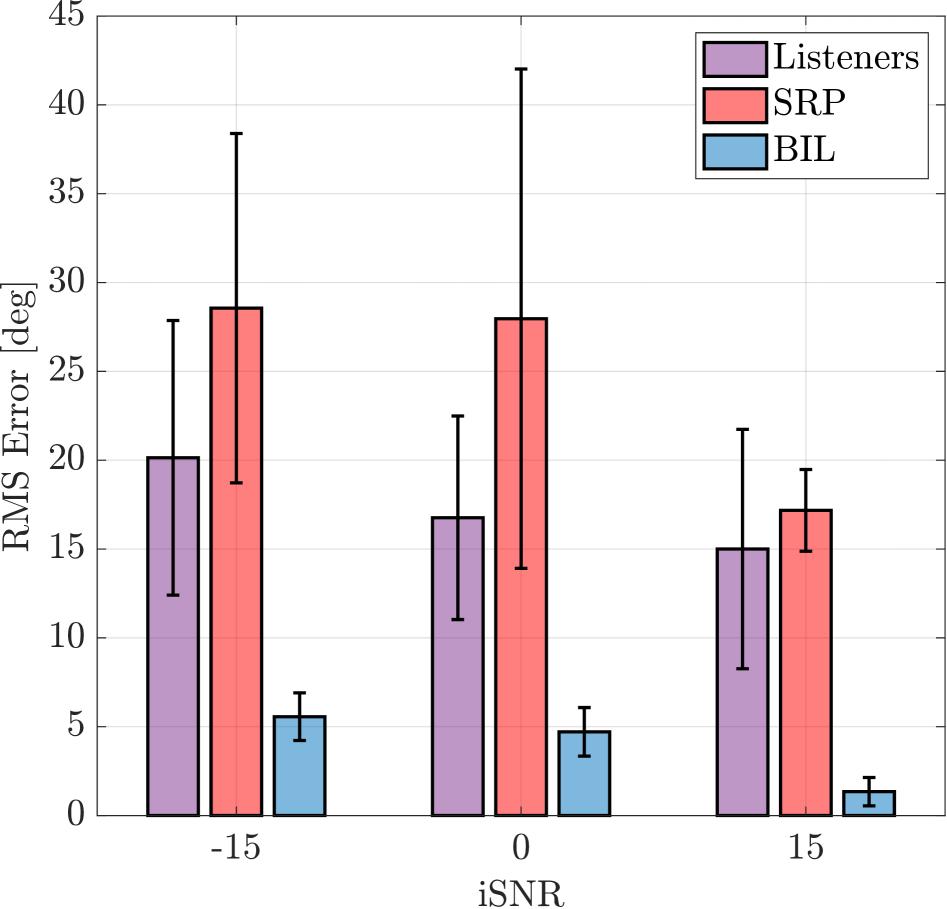
The chart compares RMS error (in degrees) across three groups—Listeners, SRP, and BIL—at three iSNR values (-15, 0, 15). Error bars represent uncertainty in measurements. SRP consistently shows the highest error, while BIL has the lowest.
### Components/Axes
- **X-axis**: iSNR (signal-to-noise ratio), labeled with ticks at -15, 0, and 15.
- **Y-axis**: RMS Error [deg], scaled from 0 to 45.
- **Legend**: Located in the top-right corner, with:
- Purple = Listeners
- Red = SRP
- Blue = BIL
- **Bars**: Grouped by iSNR, with three bars per group (one per category).
### Detailed Analysis
1. **iSNR = -15**:
- **Listeners**: ~20° (±3° uncertainty).
- **SRP**: ~28° (±5° uncertainty).
- **BIL**: ~5° (±1° uncertainty).
2. **iSNR = 0**:
- **Listeners**: ~16° (±4° uncertainty).
- **SRP**: ~27° (±6° uncertainty).
- **BIL**: ~4° (±1° uncertainty).
3. **iSNR = 15**:
- **Listeners**: ~15° (±2° uncertainty).
- **SRP**: ~17° (±3° uncertainty).
- **BIL**: ~1° (±0.5° uncertainty).
### Key Observations
- **SRP** has the highest RMS error across all iSNR values, with error bars indicating significant variability (e.g., ±6° at iSNR=0).
- **BIL** consistently shows the lowest error, with minimal uncertainty (e.g., ±0.5° at iSNR=15).
- **Listeners** exhibit a decreasing trend in error as iSNR increases (20° → 15°).
- SRP’s error bars are longest at iSNR=-15 and 0, suggesting higher measurement uncertainty in low-SNR conditions.
### Interpretation
The data suggests that **SRP** (likely a system or method) performs poorly compared to **BIL** and **Listeners**, with higher RMS error and greater variability. The trend of decreasing error with increasing iSNR implies that higher signal-to-noise ratios improve performance for all groups. However, SRP’s persistent high error—even at iSNR=15—highlights a potential flaw in its design or implementation. BIL’s near-zero error at iSNR=15 may indicate superior robustness or accuracy in high-SNR conditions. The error bars underscore the reliability of BIL’s measurements versus SRP’s inconsistency.