## Bar Chart: R1-Llama | AIME25
### Overview
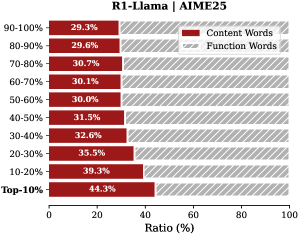
The chart compares the distribution of **Content Words** (red) and **Function Words** (gray with diagonal stripes) across 10 percentage-based categories (e.g., 90-100%, 80-90%, ..., Top-10%). Each category represents a range of values, with the x-axis showing the ratio (%) of each word type within those ranges.
### Components/Axes
- **Title**: "R1-Llama | AIME25" (top-center).
- **X-Axis**: Labeled "Ratio (%)" with a scale from 0 to 100.
- **Y-Axis**: Categories listed vertically from top to bottom:
`90-100%`, `80-90%`, `70-80%`, `60-70%`, `50-60%`, `40-50%`, `30-40%`, `20-30%`, `10-20%`, `Top-10%`.
- **Legend**:
- Red: **Content Words** (solid color).
- Gray (diagonal stripes): **Function Words**.
Positioned in the top-right corner.
### Detailed Analysis
- **Content Words (Red)**:
- Values decrease as the y-axis categories progress from `90-100%` to `Top-10%`:
`90-100%`: 29.3% → `Top-10%`: 44.3%.
- Highest value in `Top-10%` (44.3%), lowest in `90-100%` (29.3%).
- **Function Words (Gray)**:
- Values increase as the y-axis categories progress from `90-100%` to `Top-10%`:
`90-100%`: 70.7% → `Top-10%`: 55.7%.
- Highest value in `90-100%` (70.7%), lowest in `Top-10%` (55.7%).
- **Bar Lengths**:
- Red bars (Content Words) are consistently shorter than gray bars (Function Words) in all categories.
- Example: In `90-100%`, red = 29.3% (left), gray = 70.7% (right).
### Key Observations
1. **Inverse Relationship**: Content Words and Function Words exhibit an inverse correlation across categories.
2. **Top-10% Outlier**: The `Top-10%` category has the highest Content Words ratio (44.3%) and the lowest Function Words ratio (55.7%).
3. **Consistency**: Function Words dominate all categories, with ratios ranging from 55.7% to 70.7%.
### Interpretation
- **Data Implications**:
- The `Top-10%` category’s elevated Content Words ratio suggests a focus on substantive terms in this group, possibly indicating higher quality or specificity.
- Function Words (e.g., prepositions, conjunctions) dominate in higher percentage ranges (`90-100%`), implying these categories may prioritize structural language over content.
- **Trend Verification**:
- Content Words increase monotonically from `90-100%` to `Top-10%` (29.3% → 44.3%).
- Function Words decrease monotonically (70.7% → 55.7%).
- **Anomalies**:
- No outliers; trends are consistent across all categories.
- **Contextual Relevance**:
- The chart likely reflects linguistic analysis of text data, where "Content Words" (nouns, verbs) and "Function Words" (grammatical connectors) are categorized by frequency or importance. The `Top-10%` label suggests a focus on high-impact or critical segments of the data.
## Final Notes
- All legend colors match bar colors exactly.
- No textual content in other languages detected.
- Spatial grounding confirms legend placement (top-right) and axis alignment (y-axis left, x-axis bottom).