# Technical Document Extraction: Heatmap Analysis
## Labels and Axis Titles
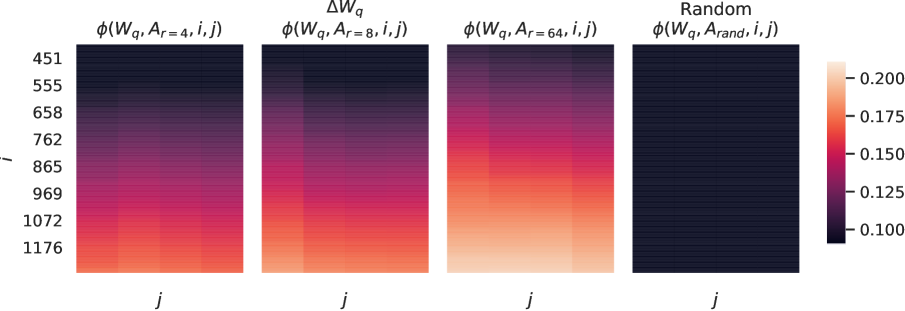
- **X-axis**: Labeled `j` across all heatmaps.
- **Y-axis**: Numerical values increasing from top to bottom:
`451, 555, 658, 762, 865, 969, 1072, 1176`.
- **Color Scale**:
- Range: `0.100` (dark purple) to `0.200` (light yellow).
- Gradient: Dark purple → Purple → Red → Orange → Light yellow.
## Heatmap Titles and Parameters
1. **First Heatmap**:
- Title: `φ(W_q, A_r=4, i,j)`
- Observations: Gradual gradient from dark purple (top) to light yellow (bottom).
2. **Second Heatmap**:
- Title: `ΔW_q`
- Observations: Similar gradient to the first heatmap, with slightly darker tones at the top.
3. **Third Heatmap**:
- Title: `φ(W_q, A_r=64, i,j)`
- Observations: Stronger gradient, with lighter tones concentrated in the lower half.
4. **Fourth Heatmap**:
- Title: `Random φ(W_q, A_rand, i,j)`
- Observations: Uniform dark purple across all cells (no gradient).
## Color Scale and Data Representation
- **Color Intensity**:
- Darker shades (purple) correspond to lower values (`~0.100`).
- Lighter shades (yellow) correspond to higher values (`~0.200`).
- **Consistency**:
- The color scale is consistent across all heatmaps, enabling direct comparison of value ranges.
## Key Trends
1. **Parameter Impact**:
- Increasing `A_r` (from `4` to `64`) correlates with a more pronounced gradient in the heatmaps.
- The `Random` heatmap shows no variation, suggesting no dependency on `i` or `j` when `A_r` is randomized.
2. **Value Distribution**:
- The first three heatmaps exhibit a clear vertical gradient, indicating a systematic relationship between `i` (y-axis) and the measured values.
- The `Random` heatmap lacks any gradient, confirming the absence of structured data.
## Cross-Reference Validation
- **Legend Colors**:
- The color bar (`0.100` to `0.200`) aligns with the visual intensity of all heatmaps.
- Darker regions in the `Random` heatmap match the lowest value (`0.100`), while lighter regions in the third heatmap align with the highest value (`0.200`).