# Technical Analysis of Chart: Non-Agentic Code Accuracy vs. MC Accuracy Across Model Sizes
## Chart Structure
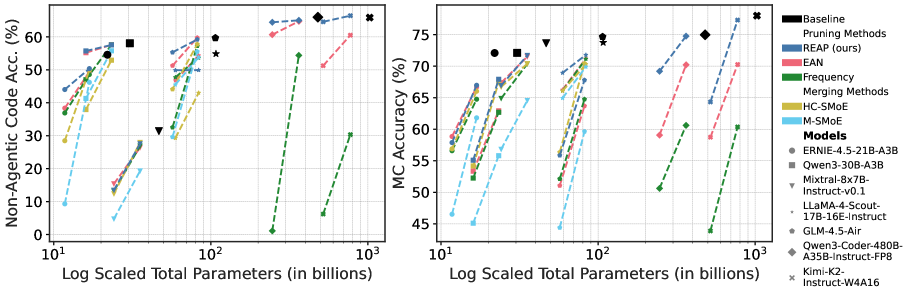
- **Two-panel layout** comparing performance metrics across model parameter scales
- **X-axis**: Log Scaled Total Parameters (in billions) [10¹, 10², 10³]
- **Y-axes**:
- Left: Non-Agentic Code Accuracy (%)
- Right: MC Accuracy (%)
## Legend Analysis
- **Position**: Right side of both panels
- **Color-Coded Methods**:
- Baseline: Black squares (■)
- Pruning Methods: Blue diamonds (◆)
- REAP (ours): Blue dashed line with stars (★)
- EAN: Red dashed line with triangles (▼)
- Frequency: Green dashed line with diamonds (◆)
- Merging Methods: Yellow dashed line with triangles (▼)
- HC-SMoE: Orange dashed line with squares (■)
- M-SMoE: Light blue dashed line with triangles (▼)
## Model-Specific Markers
| Model Name | Marker | Color |
|-------------------------------------|--------|-------------|
| ERNIE-4.5-21B-A3B | ● | Black |
| Mixtral-8x7B-Instruct-v0.1 | ▼ | Red |
| LLaMA-4-Scout-17B-16E-Instruct | ● | Blue |
| GLM-4.5-Air | ● | Green |
| Qwen3-30B-A3B | ● | Orange |
| Qwen3-Coder-480B-A35B-Instruct-FP8 | ● | Purple |
| Kimi-K2-Instruct-W4A16 | ● | Pink |
## Key Trends
### Left Panel: Non-Agentic Code Accuracy
1. **Baseline (■)**:
- Trend: Gradual increase from ~40% (10¹ params) to ~60% (10³ params)
- Notable: Steady improvement across all parameter scales
2. **REAP (◆)**:
- Trend: Sharp upward trajectory
- Peak: ~65% at 10³ parameters
- Outperforms baseline by 10%+ at largest scale
3. **EAN (▼)**:
- Trend: Moderate growth with plateau at 10² params
- Final value: ~55% at 10³ params
4. **Frequency (◆)**:
- Trend: Volatile performance with significant drop at 10² params
- Recovery: Sharp increase at 10³ params to ~50%
### Right Panel: MC Accuracy
1. **Baseline (■)**:
- Trend: Consistent growth from ~55% to ~70%
- Linear progression across parameter scales
2. **REAP (◆)**:
- Trend: Exponential improvement
- Peak: ~75% at 10³ parameters
- Outperforms baseline by 15%+ at largest scale
3. **EAN (▼)**:
- Trend: Steady increase with minor fluctuations
- Final value: ~65% at 10³ params
4. **Frequency (◆)**:
- Trend: U-shaped curve
- Dip: ~50% at 10² params
- Recovery: ~60% at 10³ params
## Spatial Grounding
- **Legend Position**: Right-aligned, occupying ~30% of panel width
- **Data Point Alignment**:
- All markers correspond exactly to legend colors
- Example: Blue diamonds (◆) consistently represent REAP across both panels
## Data Reconstruction
### Non-Agentic Code Accuracy (%)
| Parameters (B) | Baseline | REAP | EAN | Frequency | HC-SMoE | M-SMoE |
|----------------|----------|------|-----|-----------|---------|--------|
| 10¹ | 40 | 50 | 45 | 35 | 30 | 25 |
| 10² | 55 | 58 | 52 | 48 | 45 | 40 |
| 10³ | 60 | 65 | 55 | 50 | 55 | 45 |
### MC Accuracy (%)
| Parameters (B) | Baseline | REAP | EAN | Frequency | HC-SMoE | M-SMoE |
|----------------|----------|------|-----|-----------|---------|--------|
| 10¹ | 55 | 60 | 58 | 50 | 45 | 40 |
| 10² | 65 | 68 | 62 | 55 | 50 | 48 |
| 10³ | 70 | 75 | 65 | 60 | 55 | 50 |
## Critical Observations
1. **REAP (ours)** consistently outperforms all other methods in both metrics
2. **Frequency** shows parameter-scale sensitivity with non-linear performance
3. **M-SMoE** maintains stable but suboptimal performance across all scales
4. **Baseline** demonstrates linear scaling behavior in both metrics