## Diagram: LeanAgent Training Pipeline
### Overview
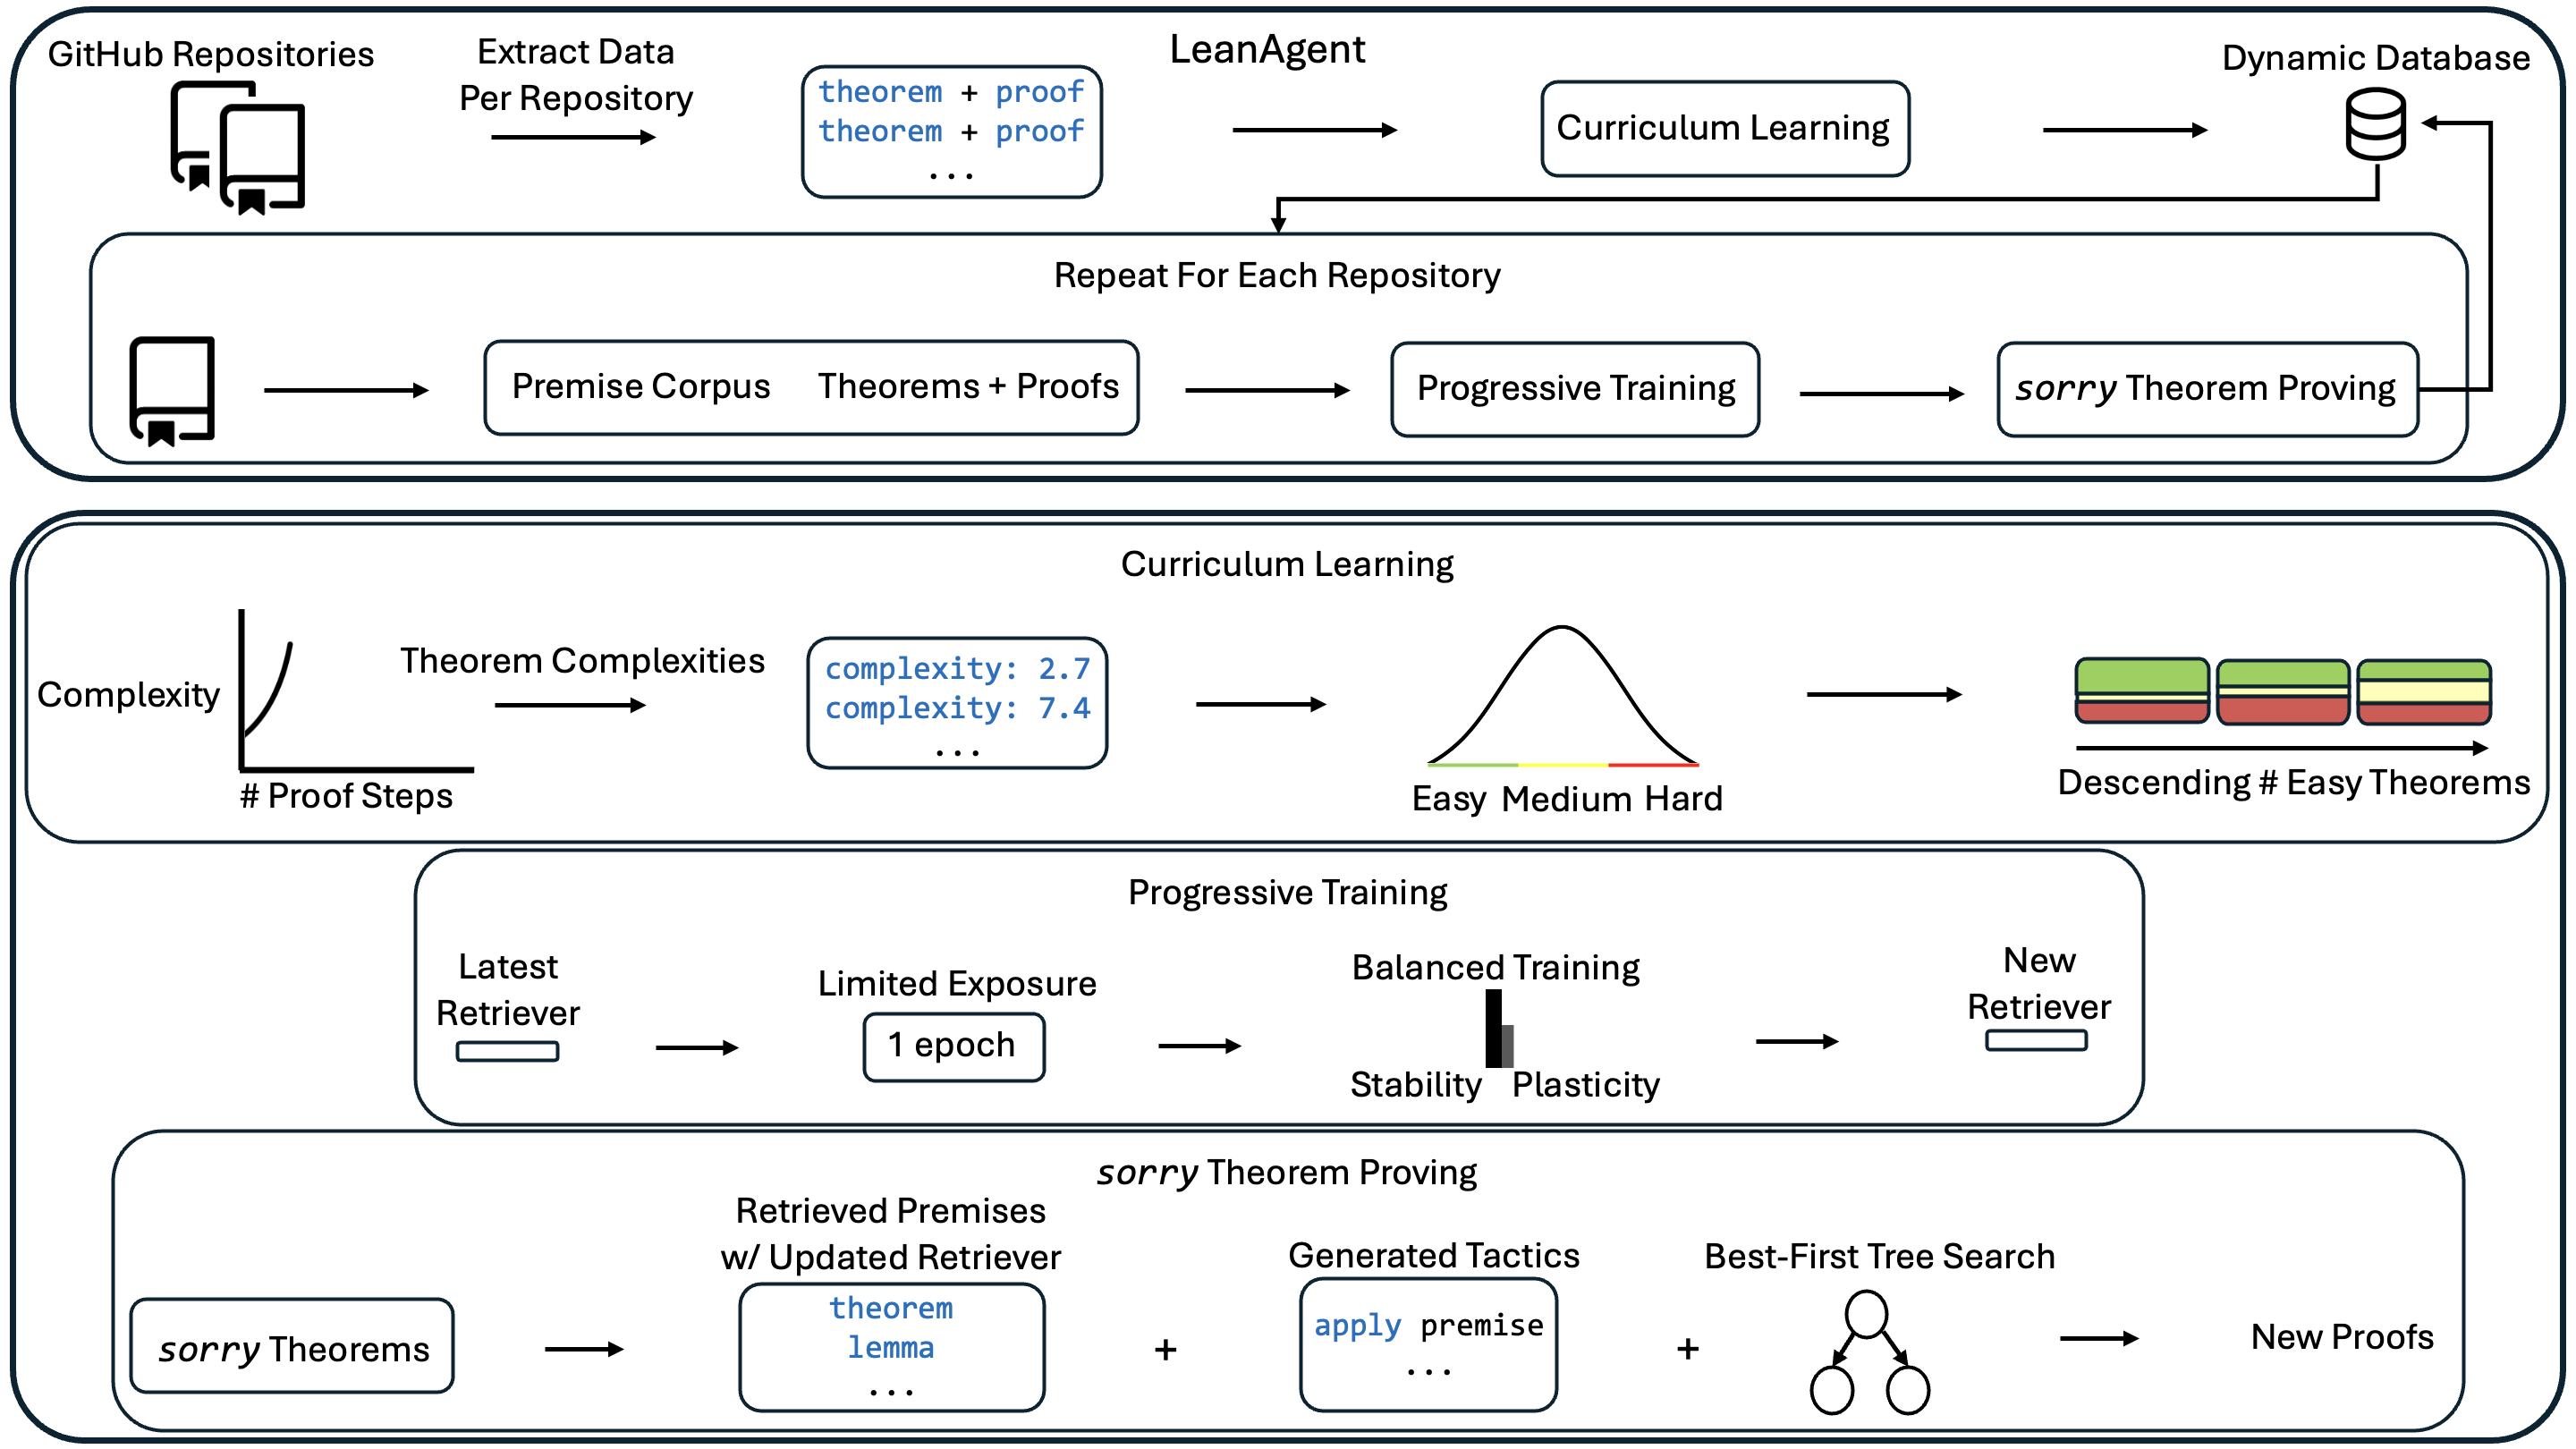
This diagram illustrates the training pipeline for a "LeanAgent" system, likely an AI agent designed for theorem proving. The pipeline involves extracting data from GitHub repositories, utilizing curriculum learning and progressive training techniques, and ultimately generating new proofs. The diagram is segmented into four main sections, visually separated by colored backgrounds: Data Extraction, Curriculum Learning, Progressive Training, and sorry Theorem Proving. Arrows indicate the flow of data and processes.
### Components/Axes
The diagram contains the following key components:
* **Data Sources:** GitHub Repositories, Premise Corpus
* **Processes:** Extract Data Per Repository, Curriculum Learning, Progressive Training, sorry Theorem Proving, Best-First Tree Search
* **Data Representations:** theorem + proof, Theorems + Proofs, Theorem Complexities, Retrieved Premises w/ Updated Retriever, Generated Tactics
* **Metrics:** Complexity, # Proof Steps
* **Databases:** Dynamic Database
* **Visualizations:** Distribution of Theorem Complexities (Easy, Medium, Hard), Descending # of Easy Theorems.
* **Parameters:** 1 epoch, Stability, Plasticity
### Detailed Analysis or Content Details
**1. Data Extraction (Top Section - Light Orange)**
* Data is extracted from "GitHub Repositories" and a "Premise Corpus".
* The extracted data consists of "theorem + proof" pairs.
* This data feeds into "Curriculum Learning" and "Progressive Training" respectively.
* The process is repeated for each repository.
**2. Curriculum Learning (Second Section - Light Green)**
* **Complexity vs. # Proof Steps:** A visual representation shows the relationship between theorem complexity and the number of proof steps.
* The x-axis is labeled "# Proof Steps".
* The y-axis is labeled "Complexity".
* A data point is shown with "complexity: 2.7" and another with "complexity: 7.4". The ellipsis ("...") indicates more data points exist.
* **Theorem Complexity Distribution:** A bell curve represents the distribution of theorem complexities, categorized as "Easy", "Medium", and "Hard".
* **Descending # of Easy Theorems:** A horizontal bar chart shows a descending number of easy theorems. The bars are colored green, yellow, and red.
**3. Progressive Training (Third Section - Light Blue)**
* **Latest Retriever -> Limited Exposure:** Data flows from the "Latest Retriever" to "Limited Exposure" (1 epoch).
* **Limited Exposure -> Balanced Training:** "Limited Exposure" feeds into "Balanced Training", which has parameters "Stability" and "Plasticity".
* **Balanced Training -> New Retriever:** "Balanced Training" outputs a "New Retriever".
**4. sorry Theorem Proving (Bottom Section - Light Purple)**
* **sorry Theorems -> Retrieved Premises:** "sorry Theorems" are input into a process that retrieves premises with an updated retriever. The retrieved premises include "theorem" and "lemma".
* **Retrieved Premises + Generated Tactics -> Best-First Tree Search:** Retrieved premises are combined with "Generated Tactics" (e.g., "apply premise").
* **Best-First Tree Search -> New Proofs:** The combined data is processed by "Best-First Tree Search" to generate "New Proofs".
### Key Observations
* The pipeline is iterative, with the "New Retriever" from Progressive Training feeding back into the "sorry Theorem Proving" stage.
* The Curriculum Learning section emphasizes the importance of complexity and proof step length in organizing the training data.
* The Progressive Training section highlights the balance between stability and plasticity in the learning process.
* The diagram uses visual cues (color-coding, arrows) to clearly indicate the flow of data and processes.
* The "sorry Theorems" component suggests the system is initially dealing with incomplete or unproven theorems.
### Interpretation
The diagram depicts a sophisticated AI training pipeline designed to learn theorem proving. The use of curriculum learning suggests a strategy of starting with simpler theorems and gradually increasing complexity. Progressive training, with its emphasis on stability and plasticity, likely aims to prevent catastrophic forgetting while still allowing the agent to adapt to new information. The iterative nature of the pipeline, with the "New Retriever" feeding back into the system, indicates a continuous learning process. The "Best-First Tree Search" component suggests a search algorithm is used to explore potential proof paths. The overall goal appears to be to automate the process of theorem proving by leveraging data from existing repositories and continuously refining the agent's learning capabilities. The use of "sorry Theorems" suggests the system is designed to tackle challenging problems where initial attempts at proving theorems may fail. The diagram provides a high-level overview of the system's architecture and training methodology, without delving into the specific algorithms or implementation details.