# Technical Data Extraction: Performance Comparison Chart (AUC)
## 1. Document Overview
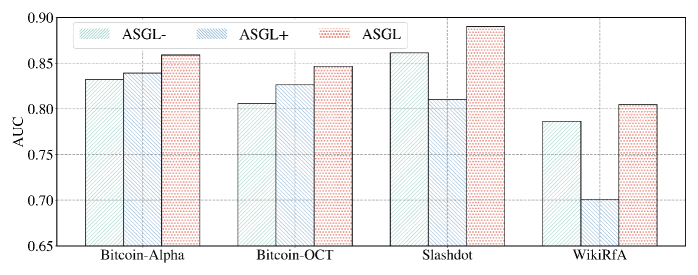
This image is a grouped bar chart comparing the performance of three algorithmic variants across four distinct datasets. The performance metric used is **AUC** (Area Under the ROC Curve).
## 2. Component Isolation
### A. Header / Legend
* **Location:** Top-left quadrant, overlaid on the chart area.
* **Legend Items:**
1. **ASGL-**: Represented by a light teal bar with diagonal hatching (bottom-left to top-right).
2. **ASGL+**: Represented by a light blue bar with diagonal hatching (top-left to bottom-right).
3. **ASGL**: Represented by a light red/pink bar with a dotted/stippled pattern.
### B. Main Chart Area (Axes)
* **Y-Axis (Vertical):**
* **Label:** "AUC"
* **Range:** 0.65 to 0.90.
* **Major Tick Marks:** 0.65, 0.70, 0.75, 0.80, 0.85, 0.90.
* **X-Axis (Horizontal):**
* **Categories (Datasets):** Bitcoin-Alpha, Bitcoin-OTC, Slashdot, WikiRfA.
* **Gridlines:** Horizontal and vertical dashed grey lines are present to facilitate value estimation.
## 3. Data Table Reconstruction
The following table provides estimated numerical values based on the spatial positioning of the bar heights relative to the Y-axis markers.
| Dataset | ASGL- (Teal/Hatched) | ASGL+ (Blue/Hatched) | ASGL (Red/Dotted) |
| :--- | :---: | :---: | :---: |
| **Bitcoin-Alpha** | ~0.832 | ~0.839 | ~0.859 |
| **Bitcoin-OTC** | ~0.805 | ~0.826 | ~0.846 |
| **Slashdot** | ~0.862 | ~0.810 | ~0.890 |
| **WikiRfA** | ~0.786 | ~0.701 | ~0.805 |
## 4. Trend Verification and Analysis
### Dataset Trends
* **Bitcoin-Alpha:** Shows a consistent upward trend across the variants. ASGL performs best, followed by ASGL+, with ASGL- being the lowest.
* **Bitcoin-OTC:** Follows the same upward trend as Bitcoin-Alpha. ASGL > ASGL+ > ASGL-.
* **Slashdot:** Displays a "V" shaped trend or a dip. ASGL- is relatively high, ASGL+ drops significantly, and ASGL reaches the highest peak of the entire chart (approx. 0.89).
* **WikiRfA:** Displays a sharp downward trend from ASGL- to ASGL+, followed by a significant recovery for ASGL. ASGL+ performs notably poorly here, barely exceeding the 0.70 mark.
### Variant Performance Summary
* **ASGL (Red/Dotted):** This variant is the top performer across all four datasets. It consistently achieves the highest AUC, peaking at nearly 0.90 on the Slashdot dataset.
* **ASGL- vs ASGL+:** The relationship between these two is inconsistent. In the "Bitcoin" datasets, ASGL+ outperforms ASGL-. However, in the "Slashdot" and "WikiRfA" datasets, ASGL- significantly outperforms ASGL+.
* **Overall Stability:** ASGL shows the most stability in maintaining high performance (all values > 0.80), whereas ASGL+ shows the highest volatility, with a significant performance drop in the WikiRfA dataset.