# Technical Document: Chart Analysis
## Chart Title
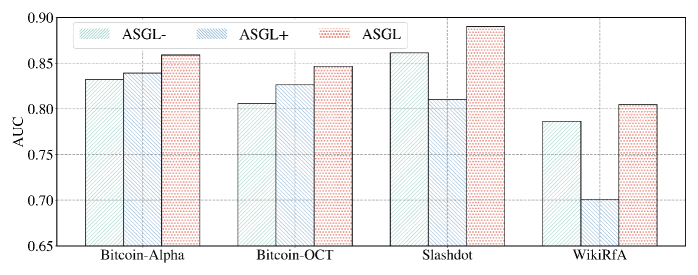
**AUC Comparison Across Datasets and Models**
## Chart Type
Bar chart with grouped bars representing model performance across datasets.
## Axes
- **X-axis**: Datasets
Categories: `Bitcoin-Alpha`, `Bitcoin-OCT`, `Slashdot`, `WikiRfA`
- **Y-axis**: AUC (Area Under the Curve)
Range: 0.65 to 0.90 (in increments of 0.05)
## Legend
- **Position**: Top-right corner
- **Labels**:
- `ASGL-`: Light blue with diagonal stripes
- `ASGL+`: Dark blue with diagonal stripes
- `ASGL`: Red with dotted pattern
## Data Points and Trends
### Dataset: Bitcoin-Alpha
- **ASGL-**: ~0.83 (light blue, diagonal stripes)
- **ASGL+**: ~0.84 (dark blue, diagonal stripes)
- **ASGL**: ~0.86 (red, dotted)
**Trend**: ASGL > ASGL+ > ASGL-
### Dataset: Bitcoin-OCT
- **ASGL-**: ~0.81 (light blue, diagonal stripes)
- **ASGL+**: ~0.83 (dark blue, diagonal stripes)
- **ASGL**: ~0.85 (red, dotted)
**Trend**: ASGL > ASGL+ > ASGL-
### Dataset: Slashdot
- **ASGL-**: ~0.86 (light blue, diagonal stripes)
- **ASGL+**: ~0.81 (dark blue, diagonal stripes)
- **ASGL**: ~0.89 (red, dotted)
**Trend**: ASGL > ASGL- > ASGL+
### Dataset: WikiRfA
- **ASGL-**: ~0.79 (light blue, diagonal stripes)
- **ASGL+**: ~0.70 (dark blue, diagonal stripes)
- **ASGL**: ~0.81 (red, dotted)
**Trend**: ASGL > ASGL- > ASGL+
## Key Observations
1. **ASGL** consistently achieves the highest AUC across all datasets, with the largest margin in `Slashdot` (~0.89).
2. **ASGL+** underperforms compared to `ASGL` in all datasets, with the steepest drop in `WikiRfA` (~0.70).
3. **ASGL-** shows moderate performance, outperforming `ASGL+` in `WikiRfA` but lagging behind `ASGL` in all cases.
4. **Slashdot** exhibits the highest overall AUC values, while **WikiRfA** has the lowest.
## Spatial Grounding
- **Legend**: Top-right corner (confirmed via visual alignment).
- **Color Consistency**:
- `ASGL-` (light blue) matches all light blue bars.
- `ASGL+` (dark blue) matches all dark blue bars.
- `ASGL` (red) matches all red bars.
## Language and Text
- **Primary Language**: English
- **No additional languages detected**.
## Component Isolation
1. **Header**: Chart title and legend.
2. **Main Chart**: Grouped bars for datasets and models.
3. **Footer**: No additional text or annotations.
## Conclusion
The chart demonstrates that `ASGL` outperforms `ASGL+` and `ASGL-` across all datasets, with the most significant advantage in `Slashdot`. `ASGL+` shows the weakest performance, particularly in `WikiRfA`.