## Diagram: Causal Relationship Inference from LLM
### Overview
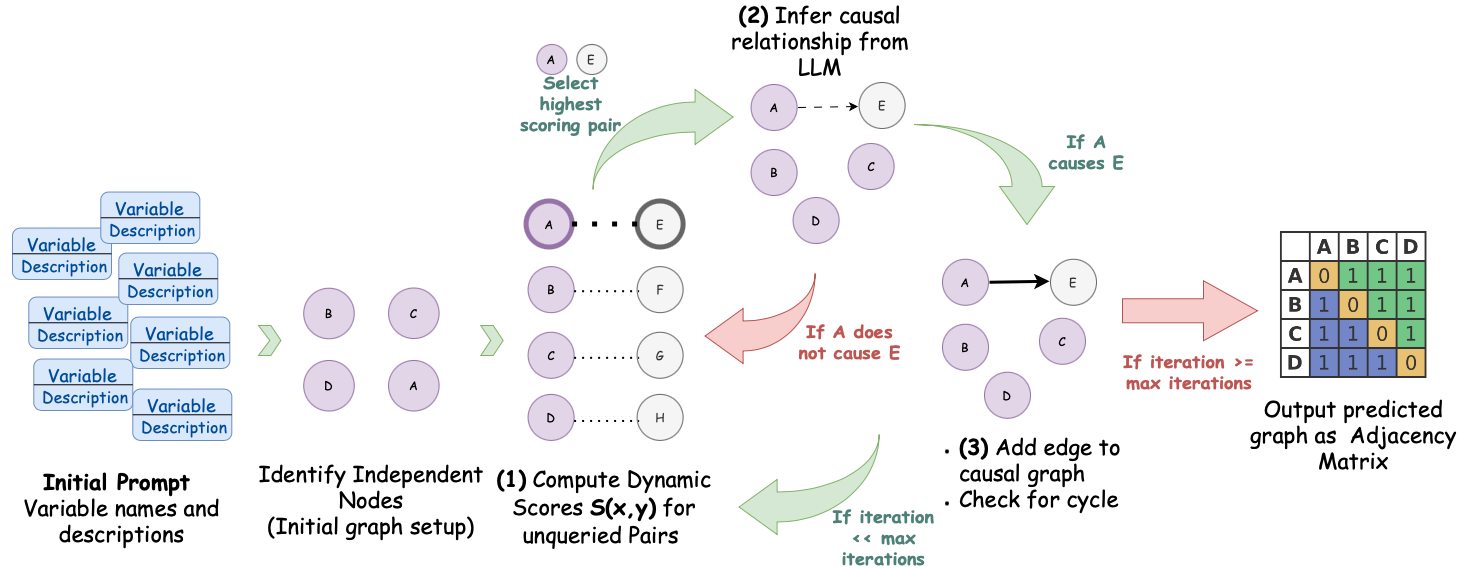
The image illustrates a process for inferring causal relationships from a Large Language Model (LLM) and representing them as an adjacency matrix. The process starts with an initial prompt of variable names and descriptions, identifies independent nodes, computes dynamic scores for unqueried pairs, infers causal relationships using the LLM, and finally outputs a predicted graph as an adjacency matrix.
### Components/Axes
* **Initial Prompt:** Contains "Variable" and "Description" labels in stacked boxes.
* **Nodes:** Represented as circles labeled with letters (A, B, C, D, E, F, G, H).
* **Edges:** Represented as arrows or dotted lines, indicating potential causal relationships.
* **Adjacency Matrix:** A table representing the predicted graph, with rows and columns labeled A, B, C, and D. The cells contain binary values (0 or 1) indicating the presence or absence of an edge between the corresponding nodes.
* **Process Steps:** Numbered steps (1, 2, 3) with descriptions of the actions performed at each step.
* **Decision Points:** Represented by arrows and conditional statements (e.g., "If A causes E", "If A does not cause E", "If iteration >= max iterations", "If iteration << max iterations").
### Detailed Analysis
1. **Initial Prompt:**
* A series of stacked boxes labeled "Variable" and "Description" are present on the left side of the diagram.
* The text "Initial Prompt Variable names and descriptions" is located below the boxes.
2. **Identify Independent Nodes (Initial graph setup):**
* Four purple circles labeled B, C, D, and A.
* A green arrow points from the "Initial Prompt" section to the "Identify Independent Nodes" section.
3. **(1) Compute Dynamic Scores S(x,y) for unqueried Pairs:**
* A green arrow points from the "Identify Independent Nodes" section to this section.
* Nodes A and E are circled with a thicker border.
* Dotted lines connect the following pairs of nodes: B-F, C-G, and D-H.
4. **(2) Infer causal relationship from LLM:**
* The text "(2) Infer causal relationship from LLM" is located at the top of this section.
* A green arrow points from the "Compute Dynamic Scores" section to this section.
* The text "Select highest scoring pair" is located near nodes A and E.
* A green arrow labeled "If A causes E" points downwards.
* A red arrow labeled "If A does not cause E" points downwards.
* Nodes A, B, C, and D are present.
* An arrow points from A to E.
5. **(3) Add edge to causal graph. Check for cycle:**
* The text ". (3) Add edge to causal graph. Check for cycle" is located at the bottom of this section.
* A green arrow labeled "If iteration << max iterations" points back to the "Compute Dynamic Scores" section.
* Nodes A, B, C, and D are present.
* An arrow points from A to E.
6. **Output predicted graph as Adjacency Matrix:**
* A red arrow labeled "If iteration >= max iterations" points to this section.
* The text "Output predicted graph as Adjacency Matrix" is located below the matrix.
* The adjacency matrix is a 4x4 table with the following values:
| | A | B | C | D |
|---|---|---|---|---|
| A | 0 | 1 | 1 | 1 |
| B | 1 | 0 | 1 | 1 |
| C | 1 | 1 | 0 | 1 |
| D | 1 | 1 | 1 | 0 |
* The diagonal elements (A-A, B-B, C-C, D-D) are colored light orange.
* The off-diagonal elements (A-B, A-C, A-D, B-A, B-C, B-D, C-A, C-B, C-D, D-A, D-B, D-C) are colored light green.
### Key Observations
* The diagram outlines an iterative process for inferring causal relationships between variables using an LLM.
* The process involves computing dynamic scores, selecting pairs of variables, inferring causal relationships, and updating a causal graph.
* The adjacency matrix represents the final predicted graph, indicating the presence or absence of edges between nodes.
### Interpretation
The diagram illustrates a method for automating causal discovery using LLMs. The process leverages the LLM's ability to infer relationships between variables based on the provided descriptions. The iterative nature of the process allows for refinement of the causal graph over time. The adjacency matrix provides a structured representation of the inferred causal relationships, which can be used for further analysis or decision-making. The use of dynamic scores and cycle checking helps to ensure the accuracy and consistency of the inferred causal graph.