\n
## Diagram: Causal Discovery Process
### Overview
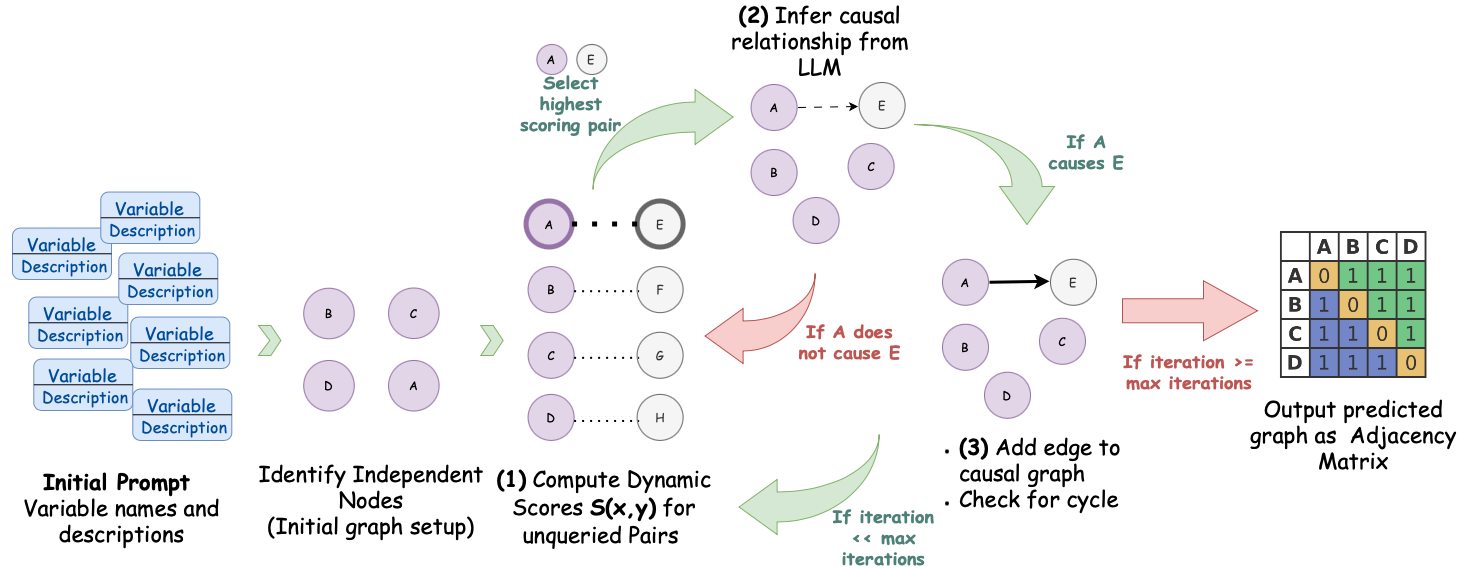
This diagram illustrates a process for causal discovery, likely using a Large Language Model (LLM). The process begins with an initial prompt containing variable names and descriptions, proceeds through dynamic score computation and causal inference, and culminates in an adjacency matrix representing the predicted causal graph. The diagram is structured as a flow chart with distinct stages.
### Components/Axes
The diagram consists of the following components:
* **Initial Prompt:** A block labeled "Initial Prompt Variables names and descriptions" with several "Variable Description" boxes connected to it.
* **Independent Nodes:** A section labeled "Identify Independent Nodes (Initial graph setup)" containing nodes labeled A, B, C, and D.
* **Dynamic Score Computation:** A section labeled "(1) Compute Dynamic Scores S(x,y) for unqueried Pairs" with dotted lines connecting nodes.
* **Causal Inference:** A section labeled "(2) Infer causal relationship from LLM" with a decision point based on whether A causes E.
* **Edge Addition & Cycle Check:** A section labeled "(3) Add edge to causal graph • Check for cycle"
* **Output:** A section labeled "Output predicted graph as Adjacency Matrix" displaying a 4x4 matrix.
* **Arrows:** Green arrows indicate the flow of the process.
* **Decision Branch:** A red arrow indicates the alternative path if A does not cause E.
### Detailed Analysis or Content Details
**Initial Prompt:** The initial prompt consists of multiple "Variable Description" blocks, suggesting a set of variables with associated textual descriptions are provided as input. The number of these blocks is approximately 6.
**Independent Nodes:** Four nodes are identified: A, B, C, and D. These represent the initial independent variables.
**Dynamic Score Computation:** Dotted lines connect all possible pairs of nodes (A-E, A-F, A-G, A-H, B-E, B-F, B-G, B-H, C-E, C-F, C-G, C-H, D-E, D-F, D-G, D-H). This suggests a pairwise scoring of potential relationships between the variables.
**Causal Inference:** The process infers a causal relationship between A and E using an LLM. A decision point exists:
* **If A causes E:** An edge is added to the causal graph.
* **If A does not cause E:** The process continues without adding the edge.
**Edge Addition & Cycle Check:** After adding an edge, the diagram indicates a check for cycles in the causal graph. The process continues as long as the iteration number is less than the maximum number of iterations.
**Output (Adjacency Matrix):** The adjacency matrix is a 4x4 matrix with the following values:
| | A | B | C | D |
| :---- | :-: | :-: | :-: | :-: |
| **A** | 0 | 1 | 1 | 1 |
| **B** | 1 | 0 | 1 | 1 |
| **C** | 1 | 1 | 0 | 1 |
| **D** | 1 | 1 | 1 | 0 |
This matrix indicates the presence (1) or absence (0) of a directed edge between each pair of nodes.
### Key Observations
* The process is iterative, continuing until a maximum number of iterations is reached.
* The LLM plays a crucial role in inferring causal relationships.
* The adjacency matrix provides a concise representation of the predicted causal graph.
* The diagram highlights the importance of cycle detection to ensure a valid causal graph.
* The initial prompt provides variable descriptions, suggesting the process can handle variables with associated context.
### Interpretation
The diagram outlines a method for automated causal discovery. It leverages an LLM to infer causal relationships between variables, starting from an initial set of independent nodes and iteratively adding edges based on the LLM's predictions. The adjacency matrix serves as the final output, representing the learned causal structure. The process incorporates a cycle detection mechanism to ensure the resulting graph is a valid directed acyclic graph (DAG), a common requirement for causal models.
The use of dynamic scores suggests a quantitative measure of the strength of potential causal relationships. The LLM likely uses these scores, along with its knowledge base, to make informed decisions about which edges to add to the graph. The iterative nature of the process allows the model to refine its predictions over time, potentially leading to a more accurate causal representation.
The diagram doesn't specify the nature of the LLM or the scoring function, but it provides a high-level overview of a promising approach to causal discovery. The process appears to be designed to handle complex systems with multiple interacting variables. The adjacency matrix output is a standard format for representing causal graphs, making it easy to analyze and interpret the results.