## Flowchart: Causal Graph Construction Process
### Overview
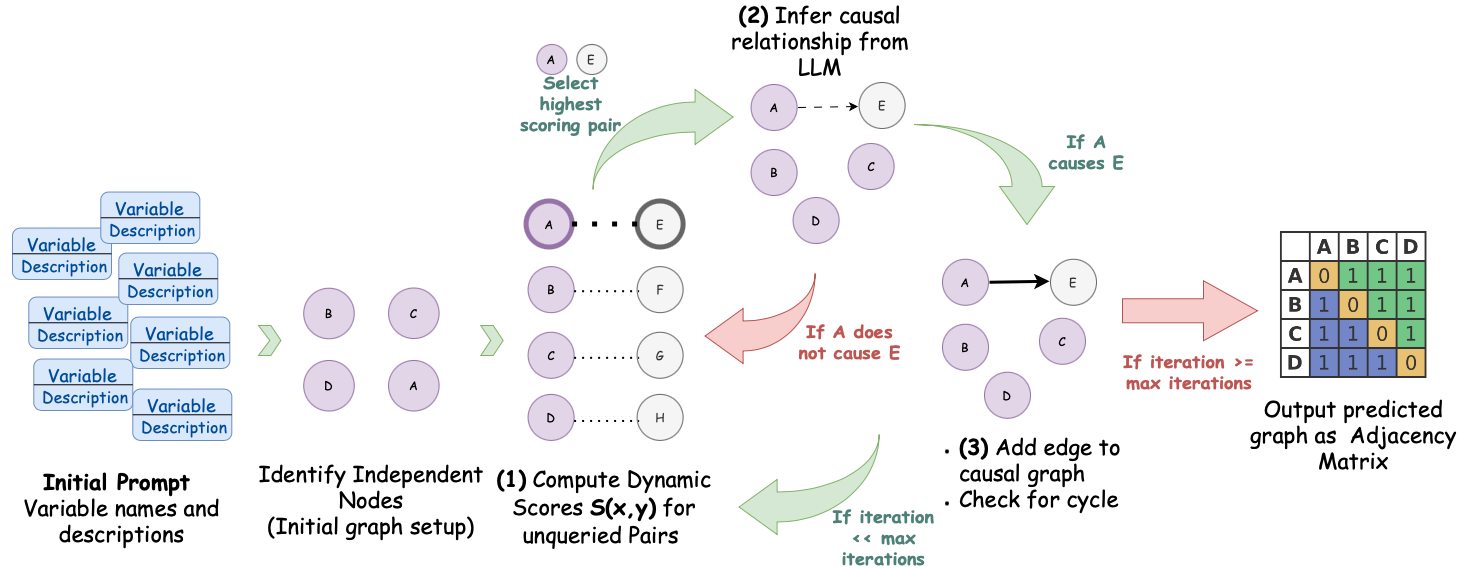
The image depicts a multi-step process for constructing a causal graph from variable relationships using a language model (LLM). It combines graph theory, dynamic scoring, and iterative causal inference to produce an adjacency matrix representation of variable dependencies.
### Components/Axes
1. **Initial Prompt Section** (Leftmost)
- Contains 6 blue rectangles labeled "Variable" and "Description" pairs
- Example: "Variable Description" (repeated 6 times)
- Spatial position: Bottom-left quadrant
2. **Graph Nodes Section** (Center-left)
- 8 purple circles labeled A-H
- Connections shown with dashed lines between nodes
- Example: A connected to E, B connected to F, etc.
3. **Dynamic Score Matrix** (Center-right)
- 4x4 grid labeled A-D on both axes
- Color-coded cells with values:
- Orange (0): A-A, B-B, C-C, D-D
- Green (1): All off-diagonal cells except bottom-right
- Blue (max iterations): Bottom-right cell (D-D)
4. **Causal Inference Section** (Right-center)
- Circular nodes with directional arrows
- Conditional logic: "If A causes E" (green arrow) vs "If A does not cause E" (red arrow)
- Iteration counter: "max iterations" threshold
5. **Output Section** (Far right)
- Final adjacency matrix with color-coded cells
- Legend: Orange=0, Green=1, Blue=max iterations
### Detailed Analysis
1. **Initial Prompt**
- Contains 6 variable-description pairs (text not specified)
- Format: "Variable" (bold) / "Description" (italic)
2. **Graph Nodes**
- 8 nodes (A-H) arranged in 2x4 grid
- Initial connections shown as dashed lines between:
- A-E, B-F, C-G, D-H
- Additional connections: B-C, C-D, D-A
3. **Dynamic Score Matrix**
- 4x4 grid with:
- Diagonal: All 0 (orange)
- Off-diagonal: Mostly 1 (green)
- Exception: D-D = max iterations (blue)
4. **Causal Inference Logic**
- Conditional checks:
- Green arrow: "If A causes E" → Add edge
- Red arrow: "If A does not cause E" → Skip edge
- Iteration limit enforced by blue cell
### Key Observations
1. **Diagonal Dominance**: All self-relations (A-A, B-B, etc.) score 0
2. **Near-Uniform Off-Diagonal**: Most variable pairs score 1 (green)
3. **Max Iterations Exception**: D-D relationship requires maximum iterations
4. **Cyclic Potential**: Multiple bidirectional connections (e.g., B-C, C-D, D-A)
### Interpretation
This process demonstrates a systematic approach to causal discovery:
1. **Data Preparation**: Variables and descriptions form the knowledge base
2. **Graph Initialization**: Nodes and preliminary connections establish relationships
3. **Dynamic Scoring**: Quantifies relationship strength between variable pairs
4. **Causal Inference**: Uses LLM to validate directional relationships
5. **Matrix Representation**: Final output encodes relationships in adjacency matrix form
The blue cell in the bottom-right corner suggests potential limitations in the model's ability to resolve certain relationships within the iteration limit. The near-uniform green cells indicate strong consensus in most variable pair relationships, while the orange diagonal confirms the expected absence of self-causation.