\n
## Diagram: Interferometer Setup
### Overview
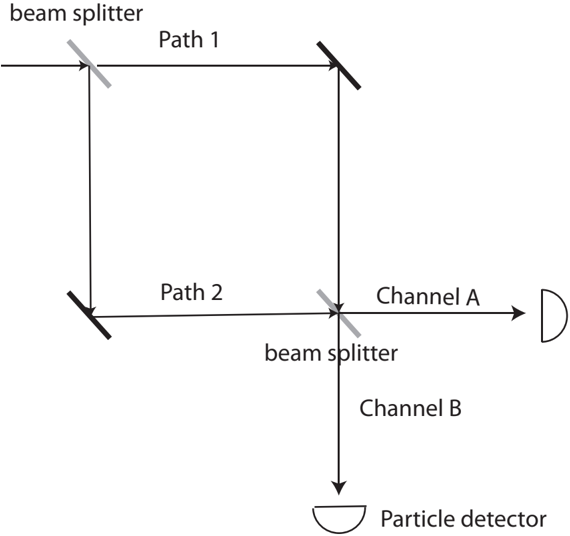
This diagram depicts a simplified interferometer setup, likely used to demonstrate wave-particle duality or interference phenomena. It shows a beam of particles (or waves) being split, directed along two paths, and then recombined before detection. The diagram is a schematic representation, focusing on the path of the beam and the key components.
### Components/Axes
The diagram includes the following labeled components:
* **beam splitter** (appears twice)
* **Path 1**
* **Path 2**
* **Channel A**
* **Channel B**
* **Particle detector**
There are no axes in this diagram. The diagram uses lines to represent the paths of the beam.
### Detailed Analysis or Content Details
The diagram shows a beam entering a "beam splitter" at the top-left. This beam splitter divides the beam into two paths: "Path 1" and "Path 2".
* **Path 1:** The beam travels horizontally, then vertically downwards, and encounters a second "beam splitter". From this second beam splitter, the beam is directed into "Channel A" and then to a detector symbol (a rectangle with a slanted line).
* **Path 2:** The beam travels vertically downwards from the first beam splitter, then horizontally, and encounters the second "beam splitter". From this second beam splitter, the beam is directed into "Channel B" and then to a "Particle detector" (represented by a parabolic shape).
The diagram does not provide any quantitative data, such as beam intensity, wavelengths, or path lengths. It is a qualitative representation of the setup.
### Key Observations
The diagram highlights the splitting and recombination of the beam. The two beam splitters are crucial components, and the paths are clearly defined. The final detection occurs in two channels, A and B, suggesting that the interference pattern is observed by measuring the particle count in each channel.
### Interpretation
This diagram illustrates a basic interferometer configuration. The purpose of such a setup is to demonstrate the wave nature of particles. When the beam is split and recombined, interference occurs, resulting in constructive and destructive interference patterns. These patterns are observed by measuring the particle count in each channel (A and B). The diagram suggests that the particle detector is used to measure the intensity of the beam in each channel, revealing the interference pattern. The diagram does not provide information about the specific type of particles being used or the details of the beam splitter. It is a conceptual illustration of the principle of interference.