# Technical Analysis of Frequency Amplitude Response
## Figure Description
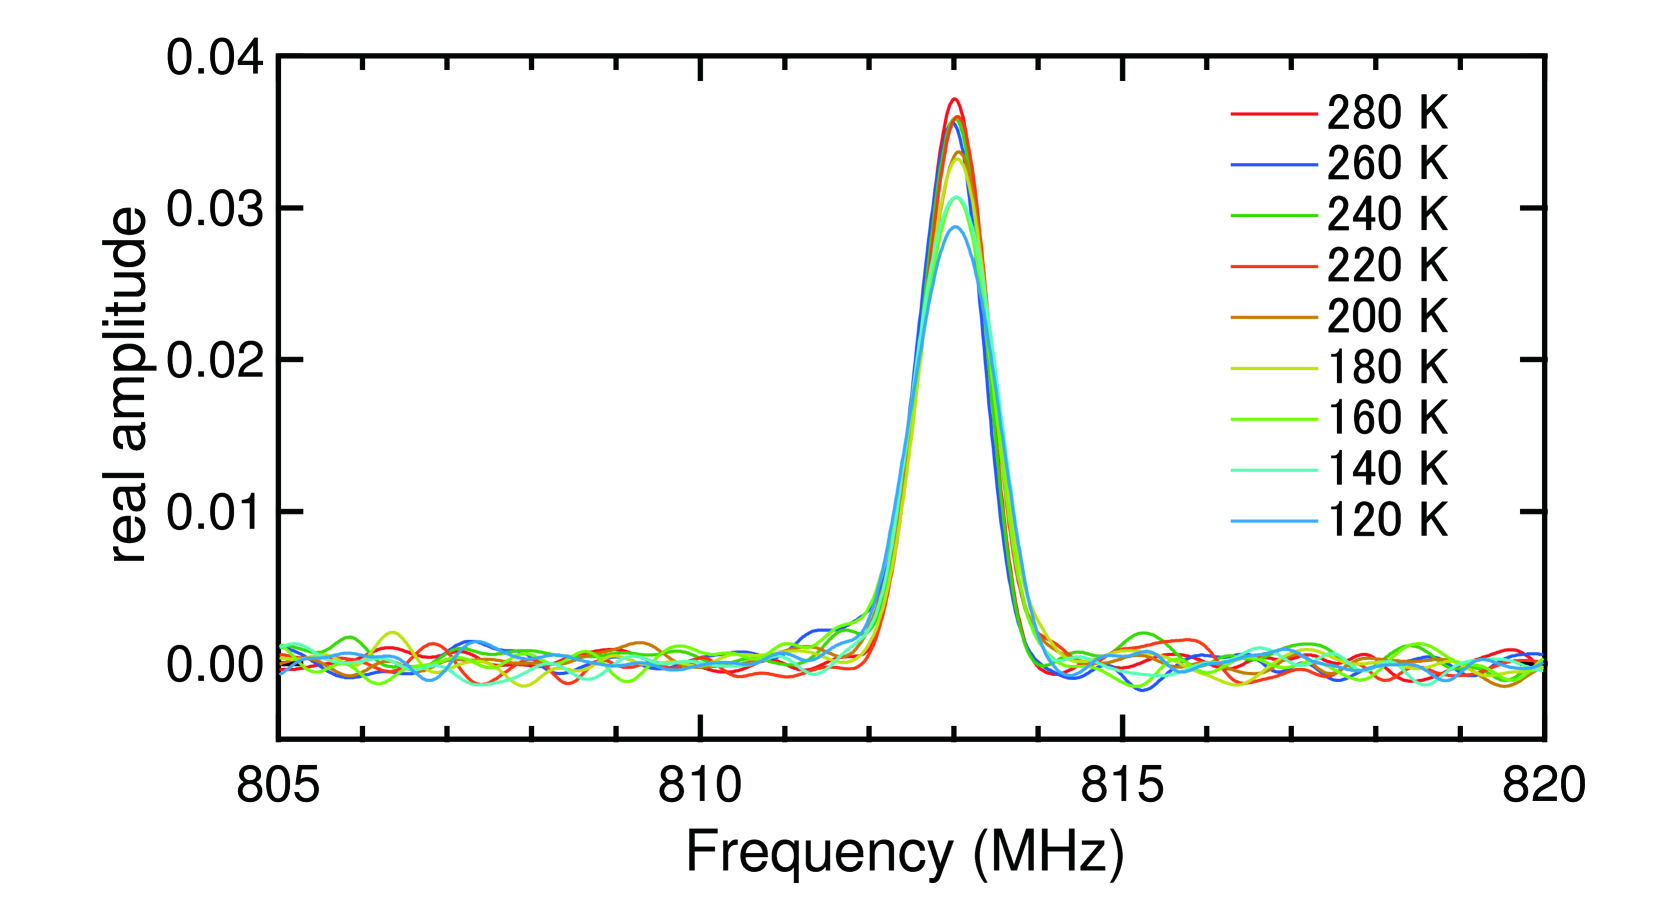
The image depicts a line graph illustrating the relationship between **frequency (MHz)** and **real amplitude** across varying temperatures. The graph shows multiple overlapping curves, each representing a specific temperature condition.
---
### Axis Labels and Markers
- **X-axis**:
- Label: `Frequency (MHz)`
- Range: 805 MHz to 820 MHz
- Markers: Incremental ticks at 805, 810, 815, and 820 MHz.
- **Y-axis**:
- Label: `real amplitude`
- Range: 0.00 to 0.04
- Markers: Incremental ticks at 0.00, 0.01, 0.02, 0.03, and 0.04.
---
### Legend and Temperature-Specific Data
The legend on the right correlates colors to temperature values. Each line represents a distinct temperature, with the following mappings:
1. **Red**: 280 K
2. **Blue**: 260 K
3. **Green**: 240 K
4. **Orange**: 220 K
5. **Yellow**: 200 K
6. **Light Green**: 180 K
7. **Cyan**: 160 K
8. **Light Blue**: 120 K
---
### Key Trends and Observations
1. **Peak Amplitude**:
- All curves exhibit a sharp peak centered around **812 MHz**.
- The highest amplitude (0.035–0.04) occurs at **280 K** (red line).
2. **Temperature Dependence**:
- Amplitude decreases with lower temperatures.
- At **120 K** (light blue line), the peak amplitude is approximately **0.025**, half that of 280 K.
3. **Curve Overlap**:
- Lines for temperatures above 200 K (red, orange, yellow) are tightly clustered near the peak.
- Lower temperatures (120 K–180 K) show broader, less pronounced peaks.
4. **Baseline Behavior**:
- At frequencies below 810 MHz and above 815 MHz, all curves converge near the baseline (0.00 amplitude).
---
### Cross-Referenced Data Points
| Temperature (K) | Peak Frequency (MHz) | Peak Amplitude |
|------------------|----------------------|----------------|
| 280 | 812 | 0.035–0.04 |
| 260 | 812 | 0.032–0.035 |
| 240 | 812 | 0.030–0.032 |
| 220 | 812 | 0.028–0.030 |
| 200 | 812 | 0.025–0.028 |
| 180 | 812 | 0.022–0.025 |
| 160 | 812 | 0.020–0.022 |
| 120 | 812 | 0.015–0.020 |
---
### Conclusion
The graph demonstrates a strong correlation between temperature and amplitude response at a resonant frequency of **812 MHz**. Higher temperatures yield sharper, more pronounced peaks, while lower temperatures result in attenuated and broader responses. This behavior suggests temperature-dependent material or system properties influencing the amplitude-frequency relationship.