## Diagram: Neural Network Architectures
### Overview
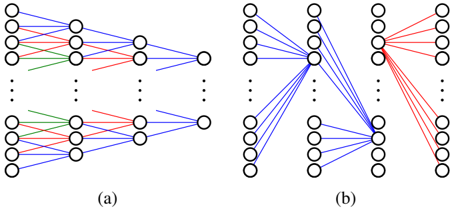
The image presents two diagrams, labeled (a) and (b), depicting different neural network architectures. Both diagrams illustrate connections between layers of nodes, with varying patterns of connectivity. Diagram (a) shows a more regular, feedforward structure, while diagram (b) exhibits more complex, potentially recurrent or skip connections.
### Components/Axes
* **Nodes:** Represented by circles. Each circle represents a neuron or processing unit.
* **Layers:** Groups of nodes arranged vertically.
* **Connections:** Represented by lines connecting nodes in different layers. The lines indicate the flow of information or signals between neurons. The connections are colored blue, red, and green.
* **Ellipsis (...):** Indicates that the pattern of layers and connections continues beyond what is explicitly shown in the diagram.
* **Labels:** (a) and (b) identify the two different network architectures.
### Detailed Analysis
**Diagram (a):**
* **Layer 1:** Contains 5 nodes.
* **Layer 2:** Contains 3 nodes.
* **Layer 3:** Contains 2 nodes.
* **Layer 4:** Contains 1 node.
* **Connections:**
* From Layer 1 to Layer 2:
* The top two nodes in Layer 1 are connected to the top node in Layer 2 with blue lines.
* The middle node in Layer 1 is connected to the middle node in Layer 2 with a green line.
* The bottom two nodes in Layer 1 are connected to the bottom node in Layer 2 with red lines.
* From Layer 2 to Layer 3:
* The top node in Layer 2 is connected to the top node in Layer 3 with a blue line.
* The bottom node in Layer 2 is connected to the bottom node in Layer 3 with a red line.
* From Layer 3 to Layer 4:
* The top node in Layer 3 is connected to the node in Layer 4 with a blue line.
* The bottom node in Layer 3 is connected to the node in Layer 4 with a blue line.
* **Trend:** The network architecture in diagram (a) appears to be a simplified feedforward network, where each layer passes information to the next layer in a structured manner. The number of nodes decreases with each subsequent layer.
**Diagram (b):**
* **Layer 1:** Contains 5 nodes.
* **Layer 2:** Contains 5 nodes.
* **Layer 3:** Contains 5 nodes.
* **Layer 4:** Contains 5 nodes.
* **Connections:**
* From Layer 1 to Layer 2:
* All 5 nodes in Layer 1 are connected to the middle node in Layer 2 with blue lines.
* From Layer 2 to Layer 3:
* All 5 nodes in Layer 2 are connected to the middle node in Layer 3 with blue lines.
* From Layer 3 to Layer 4:
* All 5 nodes in Layer 3 are connected to the top node in Layer 4 with red lines.
* **Trend:** The network architecture in diagram (b) shows a different connectivity pattern. The first two layers connect to a single node in the subsequent layer. The third layer connects to a single node in the final layer.
### Key Observations
* Diagram (a) illustrates a decreasing number of nodes per layer, suggesting a feature extraction or dimensionality reduction process.
* Diagram (b) shows a concentrated connectivity pattern, where multiple nodes in one layer feed into a single node in the next layer.
* The use of different colored lines (blue, red, green) in diagram (a) might represent different types of connections or weights.
* The ellipsis (...) in both diagrams indicates that the network can be extended to more layers.
### Interpretation
The diagrams depict two distinct neural network architectures. Diagram (a) represents a simple feedforward network, potentially used for tasks like image classification or regression, where features are progressively extracted and refined. Diagram (b) illustrates a more complex architecture, possibly involving recurrent connections or attention mechanisms, where information from multiple nodes is aggregated into a single node in the next layer. The specific function of each architecture would depend on the application and the training data used. The different colored lines in diagram (a) could represent different types of connections or weights, which might be learned during the training process.