\n
## Diagram: Neural Network Architectures
### Overview
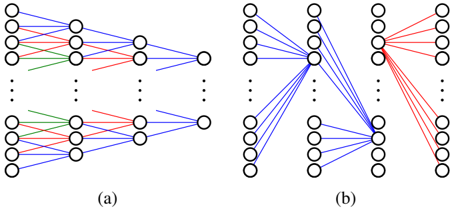
The image presents two diagrams, labeled (a) and (b), illustrating different neural network architectures. Both diagrams depict layers of nodes (circles) connected by lines representing weighted connections. The diagrams are schematic and do not contain numerical data, but rather illustrate connectivity patterns.
### Components/Axes
The diagrams consist of:
* **Nodes:** Represented by circles.
* **Connections:** Represented by lines connecting nodes between layers.
* **Colors:** Lines are colored red, green, and blue, potentially representing different types of connections or weights.
* **Labels:** "(a)" and "(b)" identify the two different architectures.
* **Ellipsis:** "..." indicates that the layers are not fully shown, implying more layers exist beyond what is visible.
### Detailed Analysis or Content Details
**Diagram (a):**
* The diagram shows a network with three layers of nodes.
* The first layer has approximately 6 nodes.
* The second layer has approximately 4 nodes.
* The third layer has approximately 3 nodes.
* Connections are made between all nodes in adjacent layers.
* The connections are colored as follows:
* Blue lines: Connect nodes in the first and second layers, and the second and third layers.
* Red lines: Connect nodes in the first and second layers, and the second and third layers.
* Green lines: Connect nodes in the first and second layers.
* The connections appear to be fully connected, with each node in one layer connected to every node in the next layer.
**Diagram (b):**
* The diagram shows a network with three layers of nodes.
* The first layer has approximately 6 nodes.
* The second layer has approximately 4 nodes.
* The third layer has approximately 3 nodes.
* Connections are made between all nodes in adjacent layers.
* The connections are colored as follows:
* Blue lines: Connect nodes in the first and second layers, and the second and third layers.
* Red lines: Connect nodes in the first and third layers.
* The connections appear to be partially connected, with some nodes in the first layer directly connected to nodes in the third layer, bypassing the second layer.
### Key Observations
* Diagram (a) represents a fully connected feedforward neural network.
* Diagram (b) represents a neural network with skip connections or shortcuts, where some nodes bypass intermediate layers.
* The use of different colors in diagram (a) suggests different types of connections or weights, potentially representing different features or pathways.
* The ellipsis indicates that the networks are likely deeper than what is shown.
### Interpretation
The diagrams illustrate two different approaches to neural network architecture design. Diagram (a) represents a standard, fully connected architecture, while diagram (b) introduces the concept of skip connections. Skip connections, as shown in diagram (b), can help address the vanishing gradient problem in deep networks, allowing gradients to flow more easily through the network during training. They can also improve the network's ability to learn complex features by providing alternative pathways for information to flow. The color coding in diagram (a) suggests that the network may be designed to process different types of information or features through different pathways. The diagrams are conceptual and do not provide specific details about the network's training or performance. They serve as a visual representation of the architectural differences between the two network types.