## Neural Network Architecture Diagram: Comparison of Connection Patterns
### Overview
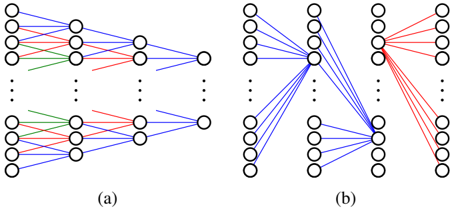
The image displays two schematic diagrams, labeled (a) and (b), illustrating different connection patterns within artificial neural networks. Both diagrams depict multi-layer networks with nodes (circles) representing neurons and lines representing connections (synapses) between them. The diagrams are presented side-by-side on a white background.
### Components/Axes
* **Diagram (a):** Located on the left side of the image.
* **Structure:** Shows a feedforward network with an input layer (leftmost column of 5 nodes), two hidden layers (middle columns, each with 5 nodes), and an output layer (rightmost column with 1 node). Vertical ellipses (three dots) between nodes in each layer indicate that the layers contain more nodes than are explicitly drawn.
* **Connections:** Lines connect nodes from one layer to the next. The connections are color-coded:
* **Blue Lines:** The most numerous, connecting various nodes across layers.
* **Red Lines:** A subset of connections, also spanning layers.
* **Green Lines:** A smaller subset, primarily visible in the lower half of the diagram.
* **Diagram (b):** Located on the right side of the image.
* **Structure:** Also shows a multi-layer network. It has an input layer (left, 5 nodes), a single hidden layer (middle, 5 nodes), and an output layer (right, 5 nodes). Vertical ellipses are present in the input and hidden layers.
* **Connections:** The connection pattern is markedly different from (a).
* **Blue Lines:** Connect all nodes from the input layer to a single, specific node in the hidden layer (the second node from the top). This hidden node then connects to all nodes in the output layer via red lines.
* **Red Lines:** Connect the central hidden node to all output nodes. Another set of red lines connects a different hidden node (the fourth from the top) to all output nodes.
* **Green Lines:** Not visibly present in diagram (b).
* **Labels:** The diagrams are labeled with lowercase letters in parentheses: "(a)" centered below the left diagram and "(b)" centered below the right diagram.
### Detailed Analysis
* **Diagram (a) - Distributed/ Dense Connectivity:**
* **Trend/Flow:** Connections are distributed across many node pairs between layers. There is no single focal point; connections originate from and terminate at various nodes throughout the layers. The color coding suggests different types or weights of connections, but all follow the same general feedforward flow from left to right.
* **Spatial Grounding:** The green connections are concentrated in the lower half of the network. Red and blue connections are interspersed throughout.
* **Diagram (b) - Focused/ Sparse Connectivity:**
* **Trend/Flow:** This diagram illustrates a "bottleneck" or "attention-like" pattern. All input information (blue lines) converges onto a single hidden node. This node then broadcasts its processed information to all output nodes (red lines). A separate hidden node also connects directly to all outputs (red lines), suggesting a parallel pathway or a different feature detector.
* **Spatial Grounding:** The primary convergence point is the second node from the top in the hidden layer. The two sets of diverging red lines originate from the second and fourth hidden nodes.
### Key Observations
1. **Architectural Contrast:** The core contrast is between a **distributed representation** (a), where information is spread across many connections and nodes, and a **focused representation** (b), where information is funneled through specific, critical nodes.
2. **Color Semantics:** While not explicitly defined, the consistent use of color implies meaning. Blue often represents input or excitatory connections, red might indicate output or inhibitory connections, and green could signify a third type (e.g., modulatory). In (b), the color shift from blue (input convergence) to red (output divergence) visually reinforces the change in information flow.
3. **Scalability Indication:** The vertical ellipses (...) are a crucial graphical element, explicitly indicating that these are simplified views of larger, scalable architectures.
4. **Node Specialization:** Diagram (b) strongly implies functional specialization of nodes. The central hidden node acts as an integrator, while others may serve as direct feature pass-throughs or perform different computations.
### Interpretation
These diagrams are likely used to explain fundamental concepts in neural network design, such as the difference between **fully connected (dense) layers** and **sparse or attention-based connections**.
* **Diagram (a)** represents a traditional, densely connected feedforward network (like a multi-layer perceptron). Its strength lies in learning complex, distributed representations but can be computationally expensive and prone to overfitting.
* **Diagram (b)** illustrates a more efficient or interpretable architecture. The convergence onto a single node mimics an **attention mechanism**, where the network learns to focus on specific aspects of the input. The direct connections from other hidden nodes to the output could represent **skip connections** (as in ResNets) or a form of **mixture of experts**, where different nodes handle different input patterns. This pattern promotes efficiency, can improve gradient flow, and often leads to more interpretable models by highlighting which internal components are responsible for certain outputs.
The visual metaphor is powerful: (a) shows a web of connections where responsibility is shared, while (b) shows a directed flow where specific nodes play critical, identifiable roles in processing information from input to output.