## Diagram: Layered Network Architecture
### Overview
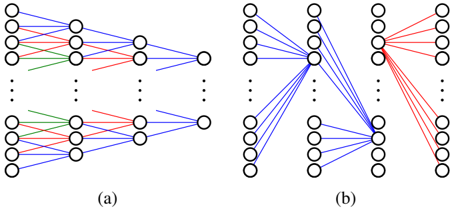
The image depicts two layered network diagrams (labeled (a) and (b)) composed of interconnected nodes (circles) and directed edges (colored lines). No textual labels, legends, or axis markers are present.
### Components/Axes
- **Nodes**: Represented as uniformly sized circles.
- **Edges**:
- **Blue lines**: Vertical connections between layers.
- **Red lines**: Diagonal connections between nodes.
- **Green lines**: Horizontal connections within layers.
- **Layers**:
- **Diagram (a)**: Two layers (top: 5 nodes, bottom: 4 nodes).
- **Diagram (b)**: Three layers (top: 4 nodes, middle: 3 nodes, bottom: 4 nodes).
### Detailed Analysis
- **Diagram (a)**:
- Top layer nodes connect to bottom layer nodes via blue vertical edges.
- Red diagonal edges link nodes across layers, suggesting cross-layer interactions.
- Green horizontal edges connect adjacent nodes within the same layer.
- **Diagram (b)**:
- Blue vertical edges dominate, connecting top to middle and middle to bottom layers.
- Red diagonal edges are sparse, primarily linking top-layer nodes to middle-layer nodes.
- Green horizontal edges are absent in the middle layer but present in top and bottom layers.
### Key Observations
1. **Layered Hierarchy**: Both diagrams emphasize vertical (blue) connections, indicating a top-down flow or dependency.
2. **Cross-Layer Interactions**: Red edges in (a) and (b) suggest secondary pathways between non-adjacent layers.
3. **Intra-Layer Connectivity**: Green edges in (a) and top/bottom layers of (b) imply local communication within layers.
4. **Asymmetry**: Diagram (b) has a more complex structure with an additional middle layer, increasing potential interaction points.
### Interpretation
The diagrams likely represent a hierarchical network architecture, such as:
- **Data Flow**: Blue edges could symbolize primary data transmission paths, while red and green edges represent auxiliary or control signals.
- **Modular Systems**: The layered structure might model subsystems (e.g., hardware/software layers, organizational departments) with defined interdependencies.
- **Redundancy**: Sparse red edges in (b) may indicate fail-safe or alternative pathways, enhancing system resilience.
**Note**: The absence of labels or legends limits precise interpretation. The color coding (blue=vertical, red=diagonal, green=horizontal) is inferred from spatial patterns.