## Chart: Logarithmic Plot of Calls vs. Clauses
### Overview
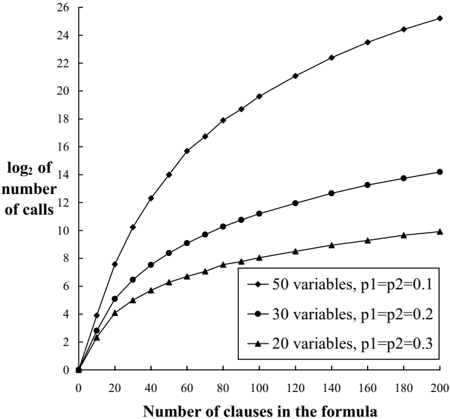
The image presents a line chart illustrating the relationship between the number of clauses in a formula and the base-2 logarithm of the number of calls, for different numbers of variables and probability values. The chart displays three data series, each representing a different configuration of variables and probabilities.
### Components/Axes
* **X-axis:** "Number of clauses in the formula", ranging from 0 to 200, with markers at intervals of 20.
* **Y-axis:** "log₂ of number of calls", ranging from 0 to 26, with markers at intervals of 2.
* **Legend:** Located in the top-right corner, containing the following entries:
* Black circle: "50 variables, p1=p2=0.1"
* Gray square: "30 variables, p1=p2=0.2"
* Black triangle: "20 variables, p1=p2=0.3"
### Detailed Analysis
The chart shows three distinct curves, each representing a different set of parameters.
* **50 variables, p1=p2=0.1 (Black Circle):** This line exhibits a steep upward slope initially, then gradually flattens out.
* At 0 clauses, log₂ of number of calls is approximately 0.
* At 20 clauses, log₂ of number of calls is approximately 4.
* At 40 clauses, log₂ of number of calls is approximately 8.
* At 60 clauses, log₂ of number of calls is approximately 11.
* At 80 clauses, log₂ of number of calls is approximately 14.
* At 100 clauses, log₂ of number of calls is approximately 17.
* At 120 clauses, log₂ of number of calls is approximately 20.
* At 140 clauses, log₂ of number of calls is approximately 22.
* At 160 clauses, log₂ of number of calls is approximately 23.
* At 180 clauses, log₂ of number of calls is approximately 24.
* At 200 clauses, log₂ of number of calls is approximately 25.
* **30 variables, p1=p2=0.2 (Gray Square):** This line also slopes upward, but less steeply than the previous one.
* At 0 clauses, log₂ of number of calls is approximately 0.
* At 20 clauses, log₂ of number of calls is approximately 3.
* At 40 clauses, log₂ of number of calls is approximately 6.
* At 60 clauses, log₂ of number of calls is approximately 9.
* At 80 clauses, log₂ of number of calls is approximately 11.
* At 100 clauses, log₂ of number of calls is approximately 12.
* At 120 clauses, log₂ of number of calls is approximately 13.
* At 140 clauses, log₂ of number of calls is approximately 13.5.
* At 160 clauses, log₂ of number of calls is approximately 14.
* At 180 clauses, log₂ of number of calls is approximately 14.5.
* At 200 clauses, log₂ of number of calls is approximately 15.
* **20 variables, p1=p2=0.3 (Black Triangle):** This line has the shallowest slope of the three.
* At 0 clauses, log₂ of number of calls is approximately 0.
* At 20 clauses, log₂ of number of calls is approximately 2.
* At 40 clauses, log₂ of number of calls is approximately 4.
* At 60 clauses, log₂ of number of calls is approximately 6.
* At 80 clauses, log₂ of number of calls is approximately 7.
* At 100 clauses, log₂ of number of calls is approximately 8.
* At 120 clauses, log₂ of number of calls is approximately 8.5.
* At 140 clauses, log₂ of number of calls is approximately 9.
* At 160 clauses, log₂ of number of calls is approximately 9.5.
* At 180 clauses, log₂ of number of calls is approximately 10.
* At 200 clauses, log₂ of number of calls is approximately 10.5.
### Key Observations
* The number of calls increases with the number of clauses for all configurations.
* The rate of increase in calls is highest for the configuration with 50 variables and p1=p2=0.1.
* The rate of increase in calls is lowest for the configuration with 20 variables and p1=p2=0.3.
* The curves demonstrate diminishing returns; the increase in calls becomes smaller as the number of clauses increases.
### Interpretation
The chart suggests that the number of calls required to solve a formula grows with the number of clauses in the formula. The growth rate is influenced by the number of variables and the probability values (p1 and p2). A higher number of variables and lower probability values lead to a faster increase in the number of calls. This likely reflects the increased complexity of the search space as the number of variables increases and the probability of satisfying a clause decreases. The logarithmic scale on the y-axis indicates that the relationship is likely exponential. The diminishing returns observed in the curves suggest that adding more clauses beyond a certain point yields progressively smaller increases in the number of calls. This could be due to the formula becoming increasingly constrained, or due to the algorithm reaching its limits in exploring the search space. The data provides insights into the computational cost of solving formulas with varying numbers of clauses, variables, and probabilities, which is relevant in areas like constraint satisfaction and automated reasoning.