\n
## Line Chart: Scalability of Computational Calls vs. Formula Complexity
### Overview
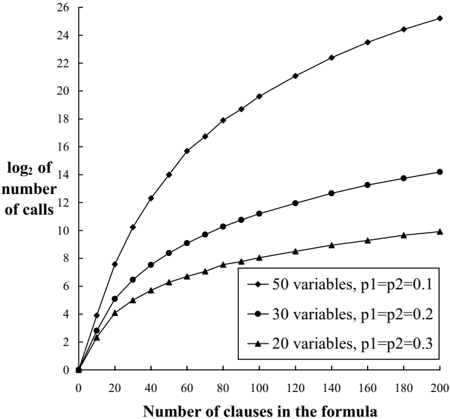
The image is a line chart plotting the base-2 logarithm of the number of calls (y-axis) against the number of clauses in a formula (x-axis). It compares three different problem configurations, showing how computational cost scales with increasing formula size. The chart demonstrates a clear, non-linear relationship where the number of calls grows exponentially with the number of clauses, and this growth rate is significantly steeper for problems with more variables.
### Components/Axes
* **Chart Type:** Line chart with markers.
* **X-Axis:**
* **Label:** "Number of clauses in the formula"
* **Scale:** Linear, ranging from 0 to 200.
* **Major Ticks:** 0, 20, 40, 60, 80, 100, 120, 140, 160, 180, 200.
* **Y-Axis:**
* **Label:** "log₂ of number of calls"
* **Scale:** Linear, representing the logarithm (base 2) of the actual call count.
* **Range:** 0 to 26.
* **Major Ticks:** 0, 2, 4, 6, 8, 10, 12, 14, 16, 18, 20, 22, 24, 26.
* **Legend:**
* **Position:** Bottom-right corner of the plot area.
* **Entries (from top to bottom in legend box):**
1. **Diamond marker (◆) with line:** "50 variables, p1=p2=0.1"
2. **Circle marker (●) with line:** "30 variables, p1=p2=0.2"
3. **Triangle marker (▲) with line:** "20 variables, p1=p2=0.3"
### Detailed Analysis
The chart displays three distinct data series, each showing an increasing, concave-down trend (the rate of increase slows slightly as clauses increase).
**1. Series: 50 variables, p1=p2=0.1 (Diamond markers ◆)**
* **Trend:** This series exhibits the steepest growth. The line rises sharply from the origin and continues to climb steeply across the entire range.
* **Approximate Data Points (x, log₂(calls)):**
* (0, 0)
* (20, ~10.0)
* (40, ~14.0)
* (60, ~16.5)
* (80, ~18.0)
* (100, ~19.5)
* (120, ~21.0)
* (140, ~22.5)
* (160, ~23.5)
* (180, ~24.5)
* (200, ~25.5)
**2. Series: 30 variables, p1=p2=0.2 (Circle markers ●)**
* **Trend:** This series shows moderate growth. It rises less steeply than the 50-variable series but more steeply than the 20-variable series.
* **Approximate Data Points (x, log₂(calls)):**
* (0, 0)
* (20, ~5.0)
* (40, ~7.5)
* (60, ~9.0)
* (80, ~10.0)
* (100, ~11.0)
* (120, ~11.5)
* (140, ~12.5)
* (160, ~13.0)
* (180, ~13.5)
* (200, ~14.0)
**3. Series: 20 variables, p1=p2=0.3 (Triangle markers ▲)**
* **Trend:** This series has the shallowest growth curve. It increases steadily but at a much lower rate compared to the other two series.
* **Approximate Data Points (x, log₂(calls)):**
* (0, 0)
* (20, ~3.0)
* (40, ~5.0)
* (60, ~6.0)
* (80, ~7.0)
* (100, ~7.5)
* (120, ~8.0)
* (140, ~8.5)
* (160, ~9.0)
* (180, ~9.5)
* (200, ~10.0)
### Key Observations
1. **Exponential Scaling:** Since the y-axis is logarithmic (log₂), the approximately linear-to-concave trends indicate that the actual number of calls (2^y) grows exponentially with the number of clauses.
2. **Dominant Factor - Variable Count:** The number of variables is the primary driver of computational cost. The 50-variable problem requires orders of magnitude more calls than the 20-variable problem for the same number of clauses (e.g., at 200 clauses: ~2^25.5 vs. ~2^10 calls).
3. **Secondary Factor - Probability Parameters (p1, p2):** The chart suggests an inverse correlation between the probability parameters (p1, p2) and the growth rate. The series with the lowest probabilities (0.1) has the steepest curve, while the series with the highest probabilities (0.3) has the shallowest. This implies that lower clause/variable occurrence probabilities lead to harder computational instances.
4. **Convergence at Origin:** All three series originate at (0,0), meaning a formula with zero clauses requires zero calls (log₂(1)=0), which is a logical baseline.
5. **Divergence with Scale:** The performance gap between the configurations widens dramatically as the number of clauses increases. The lines fan out, showing that scalability is highly sensitive to the problem's initial parameters (variable count and probabilities).
### Interpretation
This chart likely visualizes the performance of a search or satisfiability algorithm (e.g., for Boolean formulas). The "number of calls" probably refers to recursive calls, unit propagations, or some core computational step.
The data demonstrates a classic **combinatorial explosion**. The exponential relationship (linear on a log plot) confirms that the problem is computationally hard (likely NP-hard). The key insight is that the **number of variables is a more critical parameter for scalability than the number of clauses** within the tested range. A problem with 50 variables becomes intractable much faster than one with 20 variables as the formula grows.
The inverse relationship with `p1` and `p2` is particularly interesting. These parameters likely control the density or structure of the generated formulas. Lower probabilities might create more "sparse" or "unstructured" formulas that are harder for the algorithm to prune efficiently, leading to a larger search space. Conversely, higher probabilities might create more constraints or structure that the algorithm can exploit to reduce calls.
In summary, the chart is a technical demonstration of algorithmic complexity. It warns that for this class of problems, increasing the number of variables has a severe, non-linear impact on runtime, and the inherent structure of the problem (governed by p1, p2) significantly modulates this difficulty. This information is crucial for understanding the practical limits of the algorithm and for benchmarking its performance.