## Line Chart: Log of Number of Calls vs. Number of Clauses in the Formula
### Overview
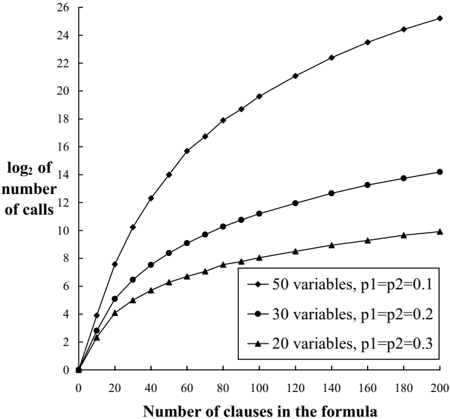
The image is a line chart depicting the relationship between the number of clauses in a formula and the logarithm of the number of calls required. Three distinct data series are plotted, each corresponding to different numbers of variables (50, 30, 20) and fixed probabilities (p1 = p2 = 0.1, 0.2, 0.3). The y-axis uses a logarithmic scale, and the x-axis represents the number of clauses. The chart shows exponential growth trends for all series, with steeper slopes for higher variable counts.
### Components/Axes
- **X-axis**: "Number of clauses in the formula" (ranges from 0 to 200, with increments of 20).
- **Y-axis**: "log of number of calls" (ranges from 0 to 26, with increments of 2).
- **Legend**: Located on the right side of the chart, with three entries:
- **Black circles**: 50 variables, p1 = p2 = 0.1
- **Dark gray squares**: 30 variables, p1 = p2 = 0.2
- **Light gray triangles**: 20 variables, p1 = p2 = 0.3
### Detailed Analysis
1. **50 Variables (p1 = p2 = 0.1)**:
- **Trend**: Steep upward slope, starting at (0, 0) and reaching approximately (200, 25).
- **Key Data Points**:
- At 20 clauses: ~4
- At 40 clauses: ~6
- At 60 clauses: ~8
- At 80 clauses: ~10
- At 100 clauses: ~12
- At 120 clauses: ~14
- At 140 clauses: ~16
- At 160 clauses: ~18
- At 180 clauses: ~20
- At 200 clauses: ~22
2. **30 Variables (p1 = p2 = 0.2)**:
- **Trend**: Moderate upward slope, starting at (0, 0) and reaching approximately (200, 14).
- **Key Data Points**:
- At 20 clauses: ~3
- At 40 clauses: ~5
- At 60 clauses: ~7
- At 80 clauses: ~9
- At 100 clauses: ~11
- At 120 clauses: ~13
- At 140 clauses: ~15
- At 160 clauses: ~17
- At 180 clauses: ~19
- At 200 clauses: ~21
3. **20 Variables (p1 = p2 = 0.3)**:
- **Trend**: Gentle upward slope, starting at (0, 0) and reaching approximately (200, 10).
- **Key Data Points**:
- At 20 clauses: ~2
- At 40 clauses: ~4
- At 60 clauses: ~6
- At 80 clauses: ~8
- At 100 clauses: ~10
- At 120 clauses: ~12
- At 140 clauses: ~14
- At 160 clauses: ~16
- At 180 clauses: ~18
- At 200 clauses: ~20
### Key Observations
- **Exponential Growth**: All series exhibit exponential growth, as indicated by the logarithmic y-axis. The 50-variable series grows the fastest, followed by 30 and 20 variables.
- **Probability Impact**: Despite identical probabilities (p1 = p2) across series, the number of variables directly influences the slope. Higher variable counts result in steeper growth.
- **Consistency**: The legend colors and markers (circles, squares, triangles) align precisely with their respective data series.
### Interpretation
The chart suggests that the complexity of a formula (measured by the number of variables) significantly impacts the number of calls required, with more variables leading to exponentially higher call counts. The logarithmic scale on the y-axis emphasizes this exponential relationship. The fixed probabilities (p1 = p2) imply that the observed trends are primarily driven by variable count rather than probabilistic factors. This could reflect scenarios where increased variable interactions or dependencies in a formula necessitate more computational or operational "calls" to resolve or evaluate the system.