\n
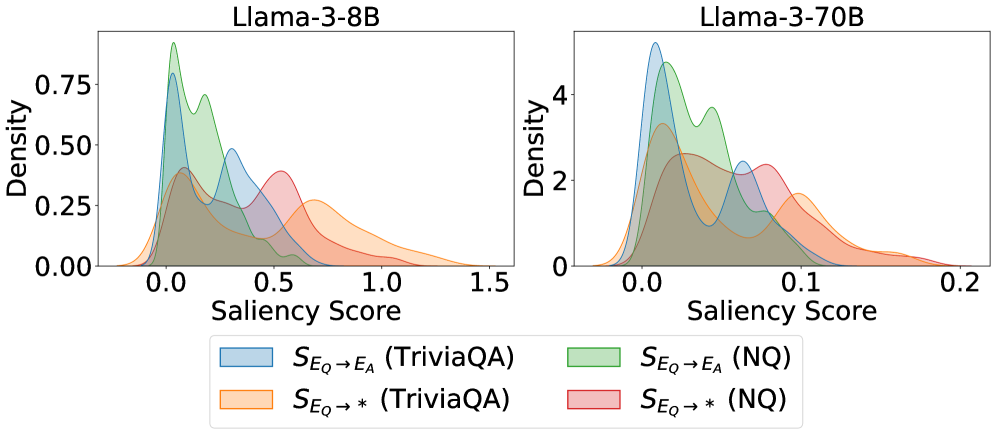
## Density Plots: Salience Score Distributions for Llama Models
### Overview
The image presents two density plots, side-by-side, visualizing the distribution of "Saliency Scores" for two different Llama models: Llama-3-8B (left) and Llama-3-70B (right). Each plot displays the density of scores for two different datasets: TriviaQA and NQ (Natural Questions). The y-axis represents "Density", and the x-axis represents "Saliency Score".
### Components/Axes
* **X-axis:** "Saliency Score". The scale ranges from approximately -0.5 to 1.5 for Llama-3-8B and from approximately -0.1 to 0.2 for Llama-3-70B.
* **Y-axis:** "Density". The scale ranges from 0.0 to 0.75 for Llama-3-8B and from 0.0 to 4.0 for Llama-3-70B.
* **Legend:** Located at the bottom of the image, the legend identifies the data series using color-coding:
* Light Blue: `S_E_Q -> E_A (TriviaQA)`
* Orange: `S_E_Q -> * (TriviaQA)`
* Light Green: `S_E_Q -> E_A (NQ)`
* Pink: `S_E_Q -> * (NQ)`
* **Titles:** Each plot has a title indicating the Llama model being analyzed: "Llama-3-8B" (left) and "Llama-3-70B" (right).
### Detailed Analysis or Content Details
**Llama-3-8B (Left Plot):**
* **S_E_Q -> E_A (TriviaQA) - Light Blue:** This line exhibits a primary peak around a Saliency Score of approximately 0.1, with a secondary, smaller peak around 0.7. The density decreases towards both ends of the scale.
* **S_E_Q -> * (TriviaQA) - Orange:** This line shows a broad distribution with a peak around a Saliency Score of 0.4. The density is relatively low across most of the range, with a slight increase towards the right.
* **S_E_Q -> E_A (NQ) - Light Green:** This line has a prominent peak around a Saliency Score of 0.0, with a rapid decline in density as the score increases.
* **S_E_Q -> * (NQ) - Pink:** This line displays a similar pattern to the green line, with a peak near 0.0, but with a slightly broader distribution and lower overall density.
**Llama-3-70B (Right Plot):**
* **S_E_Q -> E_A (TriviaQA) - Light Blue:** This line has a sharp peak around a Saliency Score of approximately 0.0, with a very rapid decline in density.
* **S_E_Q -> * (TriviaQA) - Orange:** This line shows a peak around a Saliency Score of approximately 0.05, with a similar rapid decline in density as the blue line.
* **S_E_Q -> E_A (NQ) - Light Green:** This line exhibits a peak around a Saliency Score of approximately 0.0, with a rapid decline in density.
* **S_E_Q -> * (NQ) - Pink:** This line shows a peak around a Saliency Score of approximately 0.1, with a rapid decline in density.
### Key Observations
* The Llama-3-70B model exhibits much higher density values overall compared to the Llama-3-8B model.
* For both models, the distributions for the NQ dataset (green and pink lines) are generally concentrated closer to a Saliency Score of 0.0 than the distributions for the TriviaQA dataset (blue and orange lines).
* The Llama-3-8B model shows a wider range of Saliency Scores, particularly for the TriviaQA dataset, compared to the Llama-3-70B model.
* The `S_E_Q -> *` distributions (orange and pink) are generally lower in density than the `S_E_Q -> E_A` distributions (blue and green) for both models and datasets.
### Interpretation
The plots demonstrate the distribution of saliency scores for two Llama models across two different question-answering datasets. Saliency scores likely represent the importance or relevance of certain parts of the input text when answering a question.
The higher density values for the Llama-3-70B model suggest that it may be more confident or consistent in its saliency assessments compared to the Llama-3-8B model. The concentration of scores near 0.0 for the NQ dataset indicates that the model finds less need to highlight specific parts of the input text when answering questions from this dataset, potentially because the questions are more straightforward or the relevant information is more readily available.
The difference between the `S_E_Q -> E_A` and `S_E_Q -> *` distributions suggests that the method used to calculate saliency (represented by `E_A` and `*`) impacts the resulting scores. The lower density of the `S_E_Q -> *` distributions could indicate that this method identifies fewer important parts of the input text.
The wider distribution of scores for the Llama-3-8B model on the TriviaQA dataset suggests that this dataset presents more complex or ambiguous questions, requiring the model to consider a broader range of input text segments.