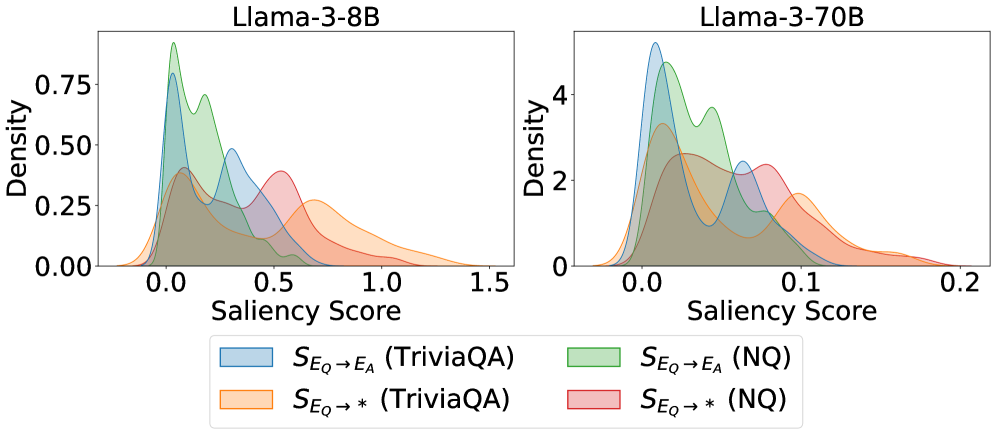
## Line Charts: Llama-3-8B and Llama-3-70B Saliency Score Distributions
### Overview
Two side-by-side density plots compare saliency score distributions for two Llama-3 model variants (8B and 70B parameters). Each chart shows four overlapping density curves representing different evaluation scenarios, with distinct color coding for TriviaQA and NQ datasets.
### Components/Axes
- **X-axis (Saliency Score)**:
- Llama-3-8B: 0.0–1.5
- Llama-3-70B: 0.0–0.2
- **Y-axis (Density)**:
- Llama-3-8B: 0.00–0.75
- Llama-3-70B: 0–4
- **Legend** (bottom center):
- Blue: S_Eq → E_A (TriviaQA)
- Green: S_Eq → E_A (NQ)
- Orange: S_Eq → * (TriviaQA)
- Red: S_Eq → * (NQ)
### Detailed Analysis
**Llama-3-8B Chart**:
- **Blue (TriviaQA)**: Peaks at ~0.5 with density ~0.6, tapering to ~0.1 at 1.5
- **Green (NQ)**: Peaks at ~0.4 with density ~0.7, broader spread than blue
- **Orange (TriviaQA*)**: Peaks at ~0.6 with density ~0.5, flatter curve
- **Red (NQ*)**: Peaks at ~0.7 with density ~0.4, most right-shifted distribution
**Llama-3-70B Chart**:
- **Blue (TriviaQA)**: Peaks at ~0.05 with density ~3.5, sharp drop-off
- **Green (NQ)**: Peaks at ~0.03 with density ~4, narrowest distribution
- **Orange (TriviaQA*)**: Peaks at ~0.07 with density ~2.5, wider than blue
- **Red (NQ*)**: Peaks at ~0.09 with density ~2, most right-shifted in 70B model
### Key Observations
1. **Scale Differences**: 70B model's saliency scores are compressed (0–0.2 vs 0–1.5), suggesting different normalization or measurement scales.
2. **Peak Density**: 8B model shows higher maximum densities (up to 0.7 vs 4 in 70B), but 70B's values are scaled differently.
3. **Distribution Shapes**:
- 8B model shows broader, more varied distributions
- 70B model exhibits sharper, more concentrated peaks
4. **Dataset Performance**:
- TriviaQA (blue/orange) consistently shows higher saliency scores than NQ (green/red)
- NQ* (red) in 8B model has the highest saliency scores (~0.7)
### Interpretation
The charts demonstrate that:
1. **Model Size Impact**: The 70B model shows more focused attention (narrower distributions) compared to 8B, but with lower absolute saliency values.
2. **Dataset Characteristics**: TriviaQA consistently elicits higher saliency scores than NQ across both models, suggesting different cognitive demands.
3. **Performance Tradeoffs**: While 70B has more precise attention (sharper peaks), 8B maintains broader coverage of saliency scores, potentially indicating better generalization.
4. **Normalization Concerns**: The stark difference in x-axis ranges between models suggests potential methodological differences in saliency score calculation or scaling between model sizes.
The data implies that larger models develop more specialized attention patterns, but smaller models may retain broader contextual awareness. The consistent TriviaQA > NQ pattern across models suggests dataset-specific cognitive processing differences.