## Bar Chart: Refusal Rates of Different Language Models
### Overview
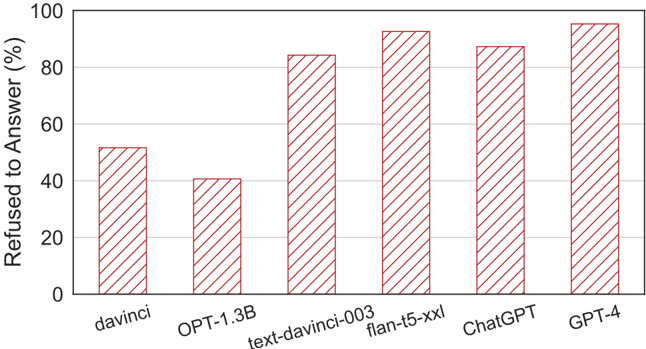
The image is a bar chart comparing the refusal rates of different language models. The y-axis represents the percentage of refused answers, ranging from 0% to 100%. The x-axis lists the language models being compared: davinci, OPT-1.3B, text-davinci-003, flan-t5-xxl, ChatGPT, and GPT-4. The height of each bar indicates the refusal rate for the corresponding model.
### Components/Axes
* **X-axis:** Language Models (davinci, OPT-1.3B, text-davinci-003, flan-t5-xxl, ChatGPT, GPT-4)
* **Y-axis:** Refused to Answer (%) - Scale from 0 to 100, with gridlines at intervals of 20.
### Detailed Analysis
The bar chart shows the following refusal rates for each language model:
* **davinci:** Approximately 52%
* **OPT-1.3B:** Approximately 40%
* **text-davinci-003:** Approximately 84%
* **flan-t5-xxl:** Approximately 92%
* **ChatGPT:** Approximately 88%
* **GPT-4:** Approximately 94%
### Key Observations
* The models 'flan-t5-xxl' and 'GPT-4' have the highest refusal rates, both exceeding 90%.
* 'OPT-1.3B' has the lowest refusal rate among the models tested, at approximately 40%.
* There is a significant difference in refusal rates between the older 'davinci' model and the newer 'text-davinci-003' model.
### Interpretation
The chart suggests that newer language models like 'flan-t5-xxl' and 'GPT-4' tend to refuse to answer questions more often than older models like 'davinci' and 'OPT-1.3B'. This could be due to stricter safety guidelines or more sophisticated mechanisms to avoid generating harmful or inappropriate content. The data indicates a trade-off between model helpfulness and safety, with newer models prioritizing safety by refusing to answer a larger percentage of questions.