## Bar Chart: Refusal Rates of AI Models
### Overview
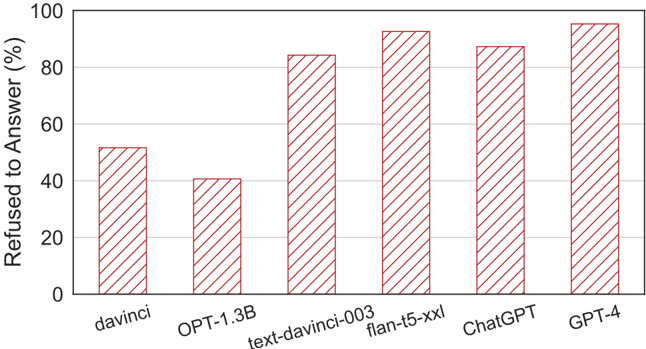
This image is a vertical bar chart comparing the percentage of times six different AI models refused to answer a query or prompt. The chart uses a single data series represented by red, diagonally hatched bars against a white background with light gray horizontal grid lines.
### Components/Axes
* **Y-Axis (Vertical):** Labeled "Refused to Answer (%)". The scale runs from 0 to 100 in increments of 20 (0, 20, 40, 60, 80, 100).
* **X-Axis (Horizontal):** Lists six AI model names. From left to right: `davinci`, `OPT-1.3B`, `text-davinci-003`, `flan-t5-xxl`, `ChatGPT`, `GPT-4`.
* **Data Series:** A single series of six bars. All bars share the same visual style: a red outline with diagonal red hatching (lines sloping from top-left to bottom-right).
* **Legend:** No separate legend is present, as there is only one data series.
* **Grid:** Light gray horizontal grid lines extend from each major tick mark on the y-axis (20, 40, 60, 80, 100).
### Detailed Analysis
The following table reconstructs the approximate data points from the chart. Values are estimated based on the bar height relative to the y-axis grid lines.
| Model (X-Axis Label) | Approximate "Refused to Answer" Percentage | Visual Trend Description |
| :--- | :--- | :--- |
| **davinci** | ~52% | The bar extends slightly above the 50% midpoint between the 40% and 60% grid lines. |
| **OPT-1.3B** | ~40% | The bar aligns almost exactly with the 40% grid line. This is the lowest value in the chart. |
| **text-davinci-003** | ~85% | The bar extends significantly above the 80% grid line, approximately one-quarter of the way to the 100% line. |
| **flan-t5-xxl** | ~95% | The bar is very tall, ending just below the 100% line. It is the second-highest bar. |
| **ChatGPT** | ~88% | The bar is taller than `text-davinci-003` but shorter than `flan-t5-xxl`. It ends closer to the 90% mark. |
| **GPT-4** | ~98% | The tallest bar, ending just a sliver below the 100% line. This is the highest value in the chart. |
**Spatial Grounding:** The bars are arranged in a single row from left to right. The legend (model names) is positioned directly below each corresponding bar on the x-axis. The y-axis label is rotated 90 degrees and placed to the left of the axis.
### Key Observations
1. **Wide Range of Refusal Rates:** There is a substantial difference (~58 percentage points) between the model with the lowest refusal rate (`OPT-1.3B` at ~40%) and the highest (`GPT-4` at ~98%).
2. **General Upward Trend:** Moving from left to right along the x-axis, there is a general, though not perfectly linear, increase in refusal rates. The sequence of models appears roughly ordered from older/less capable to newer/more capable, with refusal rates increasing accordingly.
3. **Outlier:** `OPT-1.3B` breaks the general left-to-right increasing trend, showing a lower refusal rate than the model to its left (`davinci`).
4. **High Refusal Cluster:** The four models on the right (`text-davinci-003`, `flan-t5-xxl`, `ChatGPT`, `GPT-4`) all exhibit high refusal rates, clustering between approximately 85% and 98%.
### Interpretation
The data suggests a strong correlation between the perceived capability or generation of an AI model and its propensity to refuse to answer. The chart likely illustrates the impact of safety alignment and content policy implementation, which became more sophisticated and stringent in later model iterations.
* **Safety vs. Capability Trade-off:** The trend implies that as models have become more powerful (e.g., GPT-4 vs. davinci), developers have implemented more robust refusal mechanisms, possibly to mitigate risks associated with generating harmful, biased, or inappropriate content. The high refusal rates for models like `flan-t5-xxl` and `GPT-4` indicate these systems are heavily constrained by their safety training.
* **Model Architecture & Training:** The outlier `OPT-1.3B` (an open-source model from Meta) having a lower refusal rate than the older `davinci` (an OpenAI model) could reflect different design philosophies, training data, or alignment techniques between organizations. It may prioritize helpfulness over strict safety refusal in certain contexts.
* **Practical Implications:** For users, this chart demonstrates that interacting with more advanced models may involve a higher frequency of encountering refusals, which can be perceived as either a necessary safety feature or a frustrating limitation, depending on the use case. The near-total refusal rate of GPT-4 suggests it operates under very strict guardrails.
**Note:** The chart does not specify the type of prompts or the evaluation methodology used to generate these refusal rates. The interpretation assumes the prompts were consistent across all models and were designed to test the boundaries of each model's safety protocols.