## Bar Chart: Refusal to Answer Rates by Model
### Overview
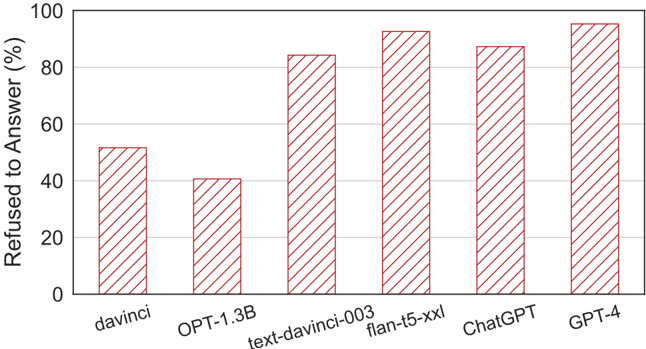
The chart displays the percentage of instances where various AI models refused to answer a query. The x-axis lists six models: davinci, OPT-1.3B, text-davinci-003, flan-t5-xxl, ChatGPT, and GPT-4. The y-axis represents the refusal rate as a percentage from 0% to 100%. All bars are visually represented with red diagonal stripes.
### Components/Axes
- **X-axis (Categories)**:
- davinci
- OPT-1.3B
- text-davinci-003
- flan-t5-xxl
- ChatGPT
- GPT-4
- **Y-axis (Scale)**:
- Labeled "Refused to Answer (%)" with increments from 0% to 100%.
- **Legend**: Not explicitly visible in the image. All bars share the same visual style (red diagonal stripes), suggesting a single data series.
### Detailed Analysis
- **davinci**: Approximately 50% refusal rate.
- **OPT-1.3B**: Approximately 40% refusal rate.
- **text-davinci-003**: Approximately 85% refusal rate.
- **flan-t5-xxl**: Approximately 90% refusal rate.
- **ChatGPT**: Approximately 85% refusal rate.
- **GPT-4**: Approximately 95% refusal rate.
### Key Observations
1. **Highest Refusal Rate**: GPT-4 (95%) and flan-t5-xxl (90%) show the highest refusal rates.
2. **Lowest Refusal Rate**: OPT-1.3B (40%) has the lowest refusal rate.
3. **Trend**: Refusal rates generally increase with model complexity or size, though there are exceptions. For example:
- ChatGPT (85%) and text-davinci-003 (85%) share the same refusal rate despite differing model architectures.
- The jump from OPT-1.3B (40%) to text-davinci-003 (85%) is significant, indicating a potential correlation between model scale and refusal behavior.
4. **Anomalies**: The slight drop in refusal rate for ChatGPT (85%) compared to flan-t5-xxl (90%) suggests variability in filtering mechanisms across models.
### Interpretation
The data suggests that larger or more advanced models (e.g., GPT-4, flan-t5-xxl) are more likely to refuse answers, possibly due to stricter content policies or safety filters. However, the consistency in refusal rates between text-davinci-003 and ChatGPT (both 85%) highlights that model architecture or training data may also influence refusal behavior. The lowest refusal rate for OPT-1.3B could indicate less restrictive filtering or a different design philosophy. This chart underscores the variability in how AI systems handle user queries, with implications for transparency and user trust.