## Scatter Plot: Task Success Rate vs. General Quality
### Overview
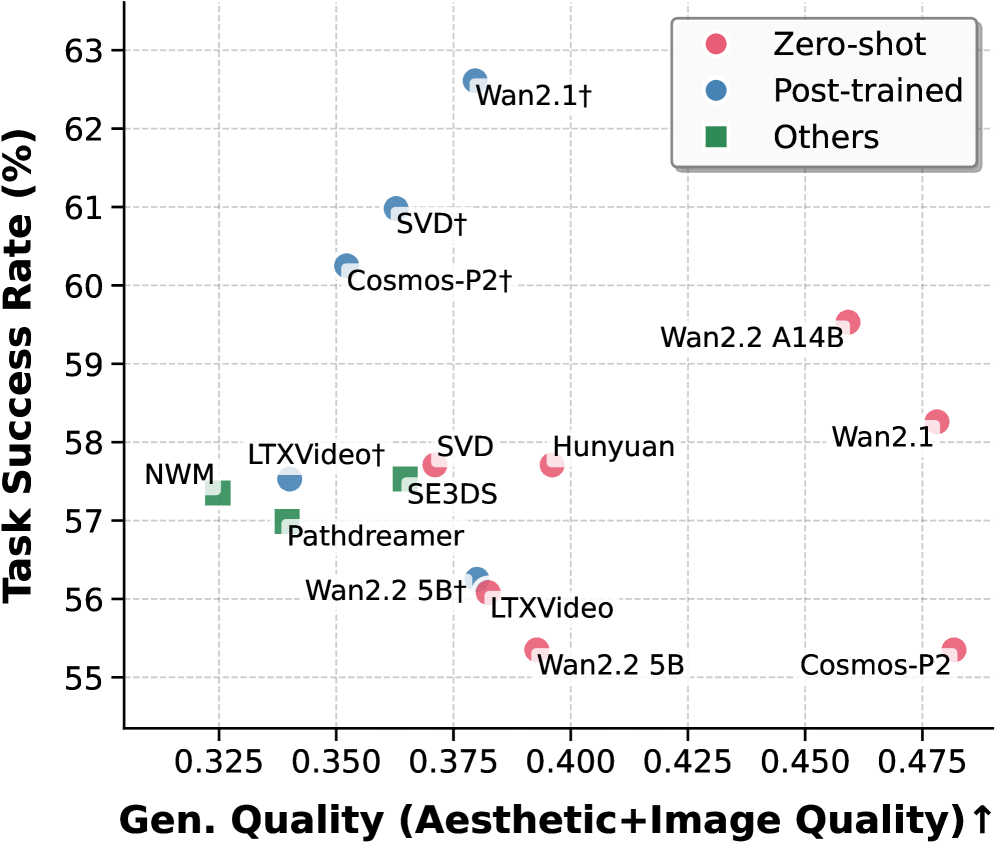
The image is a scatter plot comparing the Task Success Rate (in percentage) against the General Quality (Aesthetic + Image Quality) for various models. The plot categorizes the models into three groups: Zero-shot, Post-trained, and Others, represented by different colored markers.
### Components/Axes
* **Title:** None explicitly present in the image.
* **X-axis:** "Gen. Quality (Aesthetic+Image Quality) ↑". The axis ranges from approximately 0.325 to 0.475, with gridlines at intervals of 0.025.
* **Y-axis:** "Task Success Rate (%)". The axis ranges from 55% to 63%, with gridlines at intervals of 1%.
* **Legend:** Located in the top-right corner.
* Red circle: "Zero-shot"
* Blue circle: "Post-trained"
* Green square: "Others"
### Detailed Analysis
The scatter plot shows the distribution of different models based on their general quality and task success rate.
* **Zero-shot (Red circles):**
* "Wan2.1†": Located at approximately (0.375, 62.5).
* "Wan2.2 A14B": Located at approximately (0.43, 59).
* "Wan2.1": Located at approximately (0.47, 58.3).
* "Hunyuan": Located at approximately (0.40, 58).
* "Wan2.2 5B": Located at approximately (0.41, 55.3).
* "Cosmos-P2": Located at approximately (0.47, 55.2).
* **Post-trained (Blue circles):**
* "Wan2.1†": Located at approximately (0.35, 61).
* "SVD†": Located at approximately (0.35, 60.5).
* "Cosmos-P2†": Located at approximately (0.35, 60).
* "LTXVideo†": Located at approximately (0.35, 57.5).
* "Wan2.2 5B†": Located at approximately (0.37, 56.2).
* "LTXVideo": Located at approximately (0.40, 56).
* **Others (Green squares):**
* "NWM": Located at approximately (0.32, 57.4).
* "SE3DS": Located at approximately (0.38, 57.3).
* "Pathdreamer": Located at approximately (0.36, 57).
### Key Observations
* The "Wan2.1†" model (Zero-shot) has the highest task success rate among all models.
* The "Cosmos-P2" model (Zero-shot) has the lowest task success rate among all models.
* The "NWM" model (Others) has the lowest general quality among all models.
* There appears to be a positive correlation between general quality and task success rate, although it is not very strong.
### Interpretation
The scatter plot visualizes the performance of different models in terms of task success rate and general quality. The models are categorized into Zero-shot, Post-trained, and Others, allowing for a comparison of their performance within and across these categories. The plot suggests that, in general, models with higher general quality tend to have higher task success rates, but there are exceptions. For example, some Zero-shot models have high task success rates despite having relatively lower general quality. The plot can be used to identify models that perform well in both categories and to understand the trade-offs between general quality and task success rate for different types of models.