## Diagram: Data Processing Flow
### Overview
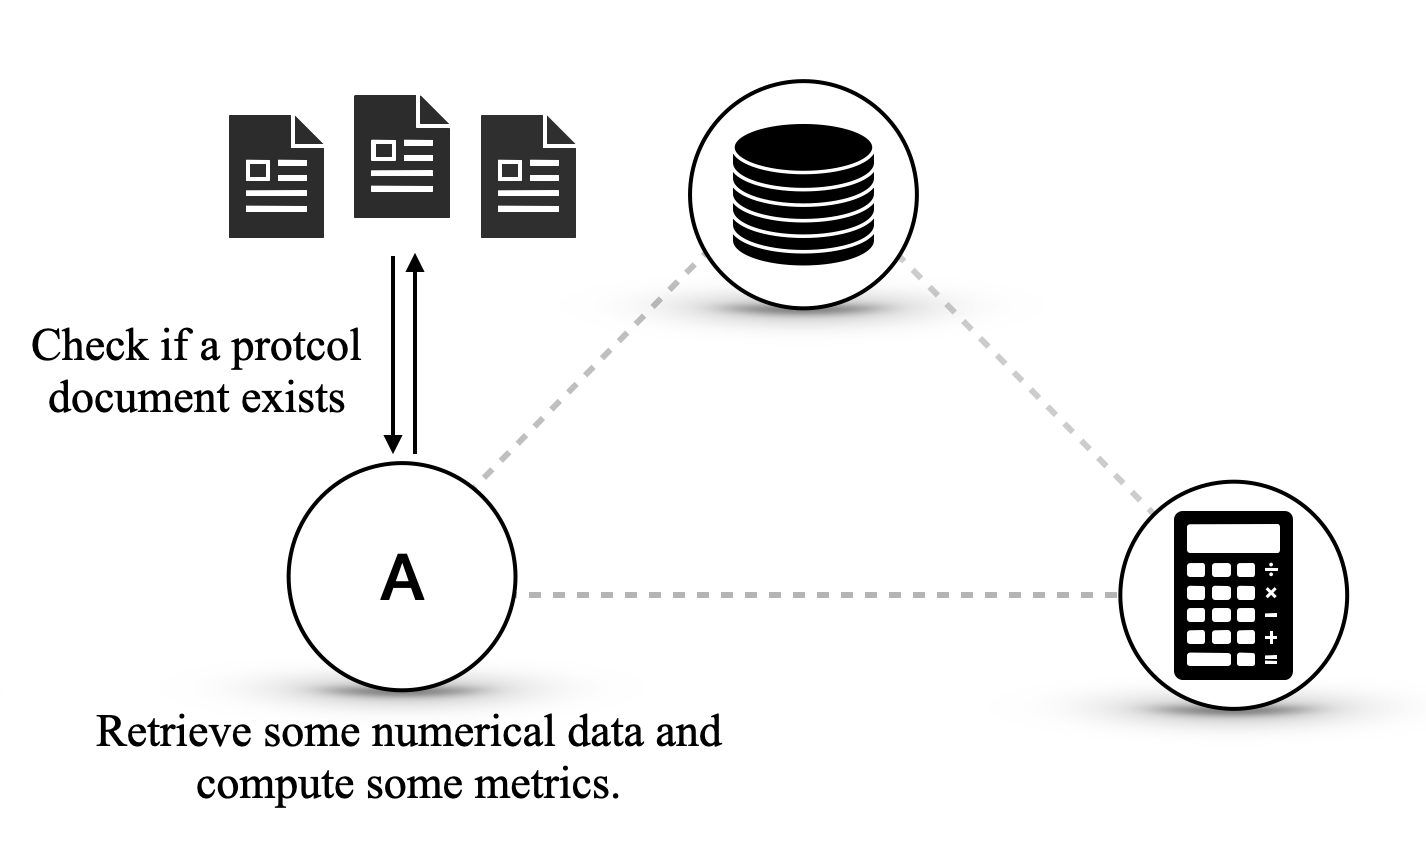
The image is a diagram illustrating a data processing flow. It depicts three distinct components: documents, a database, and a calculator, interconnected via dashed lines, with a central node labeled "A". The diagram outlines a process involving checking for protocol documents, retrieving numerical data, and computing metrics.
### Components/Axes
* **Documents:** Represented by three stacked document icons at the top-left.
* **Database:** Represented by a stack of disks within a circle at the top-right.
* **Calculator:** Represented by a calculator icon within a circle at the bottom-right.
* **Node A:** A central node labeled "A" within a circle at the bottom-left.
* **Connections:** Dashed lines connect Node A to the database and the calculator. Solid arrows point up and down between the documents and Node A.
* **Text Labels:**
* "Check if a protcol document exists" (above Node A)
* "Retrieve some numerical data and compute some metrics." (below Node A)
### Detailed Analysis
* **Documents to Node A:** Two vertical arrows, one pointing downwards from the documents to Node A and another pointing upwards from Node A to the documents, indicate a two-way interaction. The text "Check if a protcol document exists" is positioned near these arrows, suggesting a verification process.
* **Node A to Database:** A dashed line connects Node A to the database icon.
* **Node A to Calculator:** A dashed line connects Node A to the calculator icon.
* **Database to Calculator:** A dashed line connects the database icon to the calculator icon, completing a triangular relationship between the three components.
* **Node A Function:** The text "Retrieve some numerical data and compute some metrics" describes the function of Node A.
### Key Observations
* The diagram illustrates a data flow where Node A acts as a central processing unit.
* The process begins with checking for protocol documents, followed by retrieving numerical data, and then computing metrics.
* The dashed lines suggest a flow of information or data between the components.
### Interpretation
The diagram represents a simplified model of a data processing system. Node A likely represents a software component or process that interacts with documents, a database, and a calculator. The system checks for the existence of protocol documents, retrieves numerical data from the database, and performs calculations using the calculator component. The dashed lines indicate data dependencies or communication pathways between these components. The triangular relationship between the database, calculator, and Node A suggests that the database provides data for calculations, and Node A orchestrates this process. The diagram highlights the key steps and components involved in this data processing workflow.