## Diagram: System Interaction Flow
### Overview
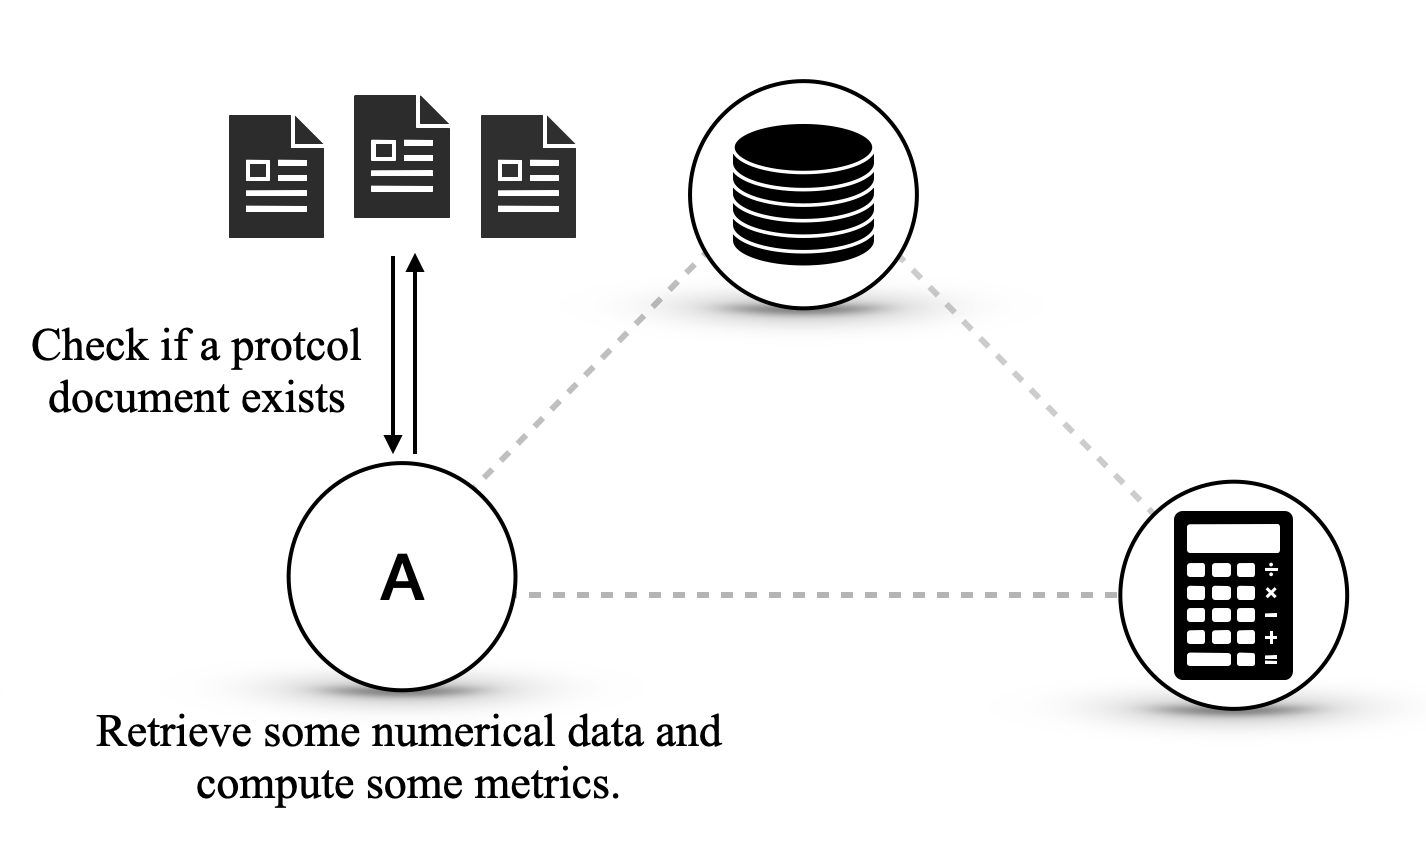
This diagram illustrates a simplified interaction flow between three components, labeled as 'A', a database icon, and a calculator icon. The interactions are depicted by arrows and dashed lines, with accompanying text describing the actions or checks performed.
### Components/Axes
The diagram does not feature traditional axes or scales as it is a conceptual illustration. The key components are:
* **Component A**: Represented by a large circle with the letter 'A' inside. This component appears to be a central processing or decision-making entity.
* **Document Icons**: Three document icons are positioned above Component A, indicating a collection of documents.
* **Database Icon**: Represented by a stack of discs within a circle, positioned to the top-right of Component A. This likely symbolizes data storage.
* **Calculator Icon**: Represented by a calculator within a circle, positioned to the bottom-right of Component A. This likely symbolizes computational or analytical processes.
* **Interaction Arrows**:
* A double-headed arrow connects the document icons to Component A, with the text "Check if a protcol document exists" positioned to the left of this arrow.
* A dashed line connects Component A to the Database Icon.
* A dashed line connects Component A to the Calculator Icon.
* A dashed line connects the Database Icon to the Calculator Icon.
* **Descriptive Text**:
* "Check if a protcol document exists" is located to the left of the arrow between the document icons and Component A.
* "Retrieve some numerical data and compute some metrics." is located below Component A.
### Detailed Analysis or Content Details
The diagram depicts the following interactions and processes:
1. **Protocol Document Check**: Component A interacts with a set of three documents. The double-headed arrow and the accompanying text "Check if a protcol document exists" indicate that Component A performs a check to determine the presence or validity of a protocol document. This interaction is bidirectional, suggesting a query and response mechanism.
2. **Data Retrieval and Computation**: Below Component A, the text "Retrieve some numerical data and compute some metrics." describes a primary function of Component A. This implies that Component A is responsible for accessing numerical data and performing calculations to derive metrics.
3. **Inter-component Connections**:
* A dashed line connects Component A to the Database Icon. This suggests that Component A can access or interact with the database, likely to retrieve the "numerical data" mentioned.
* A dashed line connects Component A to the Calculator Icon. This suggests that Component A can initiate or utilize the computational capabilities of the calculator, possibly to "compute some metrics."
* A dashed line connects the Database Icon to the Calculator Icon. This implies that the database can provide data to the calculator, or that the calculator can directly access the database.
### Key Observations
* Component A appears to be the central orchestrator, initiating checks and data processing tasks.
* The diagram suggests a workflow where protocol documents are first verified, then numerical data is retrieved from a database, and finally, metrics are computed using a calculator.
* The dashed lines suggest a less direct or asynchronous communication compared to the solid arrows, or simply represent logical connections rather than direct data flow in all cases.
### Interpretation
This diagram illustrates a conceptual model of a system where a central entity (Component A) performs several key functions. Initially, it verifies the existence of a "protocol document," which could be a prerequisite for further operations. Following this check, Component A is described as retrieving numerical data and computing metrics. The connections to the database and calculator icons suggest that these are the resources or modules Component A utilizes to fulfill its data retrieval and computation responsibilities. The connection between the database and calculator further reinforces the idea that data is processed computationally.
The overall flow suggests a process that might be found in data analysis pipelines, system validation, or compliance checking systems, where a set of rules (protocol documents) are checked, data is gathered, and then analyzed to produce meaningful insights or metrics. The diagram highlights the modularity of the system, with distinct components responsible for storage, computation, and central control/logic. The bidirectional arrow for the protocol check implies a potential for feedback or confirmation.