\n
## Diagram: Data Flow for Protocol and Metric Calculation
### Overview
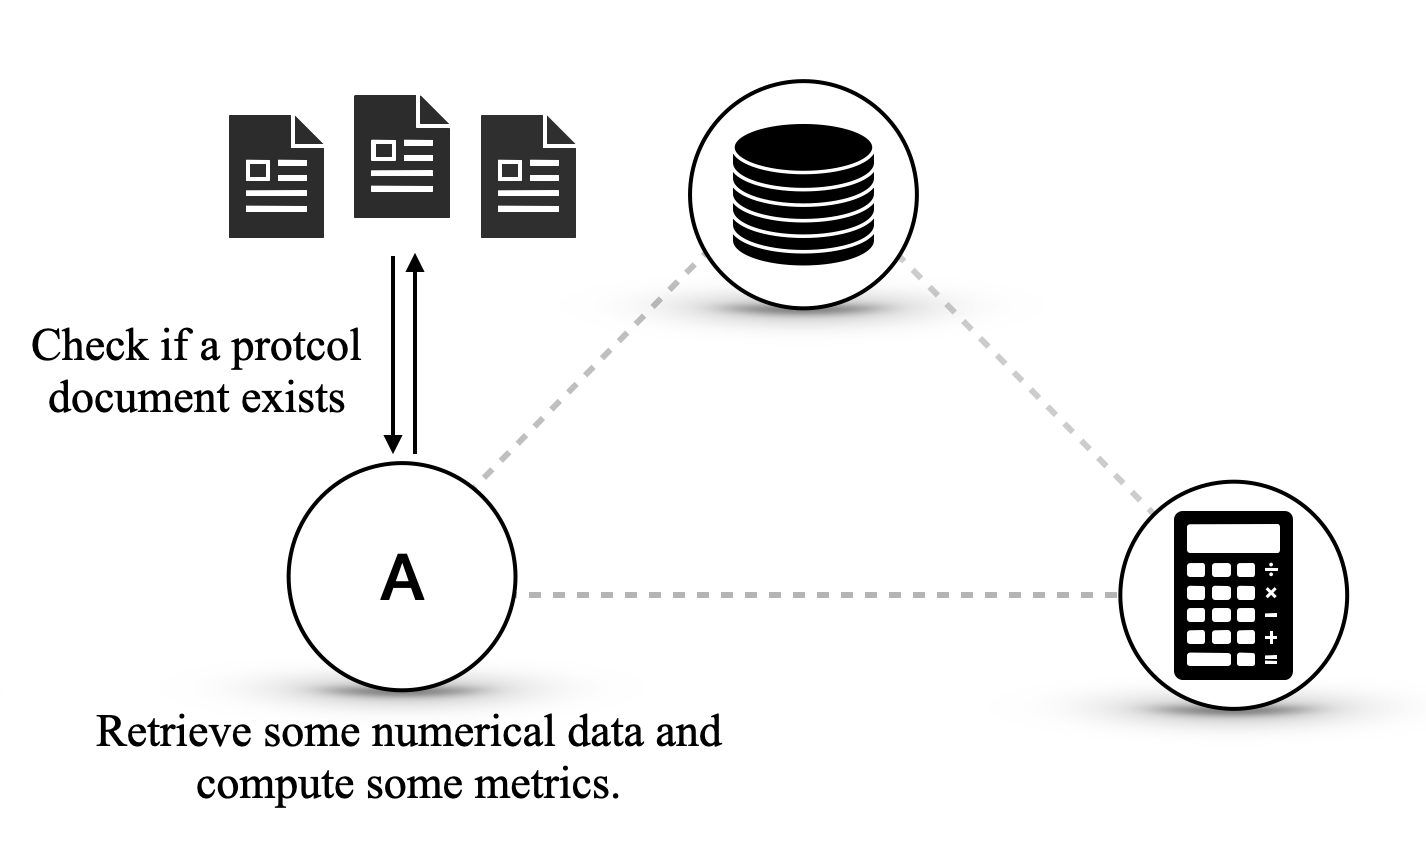
The image is a diagram illustrating a data flow process. It depicts a central component "A" interacting with document files and a database, ultimately leading to metric computation. The diagram uses simple shapes (circles, rectangles, cylinders) and dashed arrows to represent the flow of information.
### Components/Axes
The diagram consists of the following components:
* **Component A:** A central circle labeled "A".
* **Document Files:** Three rectangular icons representing document files, positioned at the top-left.
* **Database:** A cylindrical icon representing a database, positioned at the top-right.
* **Calculator:** A rectangular icon representing a calculator, positioned at the bottom-right.
* **Arrows:** Dashed arrows indicating the flow of data between components.
* **Text Labels:** Two text labels describing the actions associated with Component A.
### Detailed Analysis or Content Details
The diagram shows the following data flow:
1. **Protocol Check:** Component A receives data from the three document files (top-left) via a bidirectional dashed arrow. The label next to this arrow states: "Check if a protocol document exists".
2. **Data Retrieval:** Component A also receives data from the database (top-right) via a dashed arrow.
3. **Metric Computation:** Component A sends data to the calculator (bottom-right) via a dashed arrow. The label next to this arrow states: "Retrieve some numerical data and compute some metrics."
There are no numerical values or scales present in the diagram. The diagram is conceptual and does not contain specific data points.
### Key Observations
The diagram highlights a process where a central component ("A") checks for protocol documents, retrieves data from a database, and then uses that data to compute metrics using a calculator. The bidirectional arrow between Component A and the document files suggests a query-response interaction. The dashed lines indicate a non-direct or potentially asynchronous data flow.
### Interpretation
This diagram likely represents a workflow in a scientific or engineering context. Component "A" could be a software module or a process that needs to adhere to a specific protocol. The protocol documents are checked to ensure compliance. The database likely contains raw data, which is retrieved and processed to generate meaningful metrics. The calculator represents the computation step.
The diagram emphasizes the importance of protocol adherence and data-driven metric calculation. It suggests a system where data integrity and process validation are crucial. The lack of specific details implies that the diagram is a high-level overview of a more complex system. The diagram does not provide any information about the nature of the protocol, the type of data stored in the database, or the specific metrics being computed.