## Diagram: Protocol Document and Data Processing Workflow
### Overview
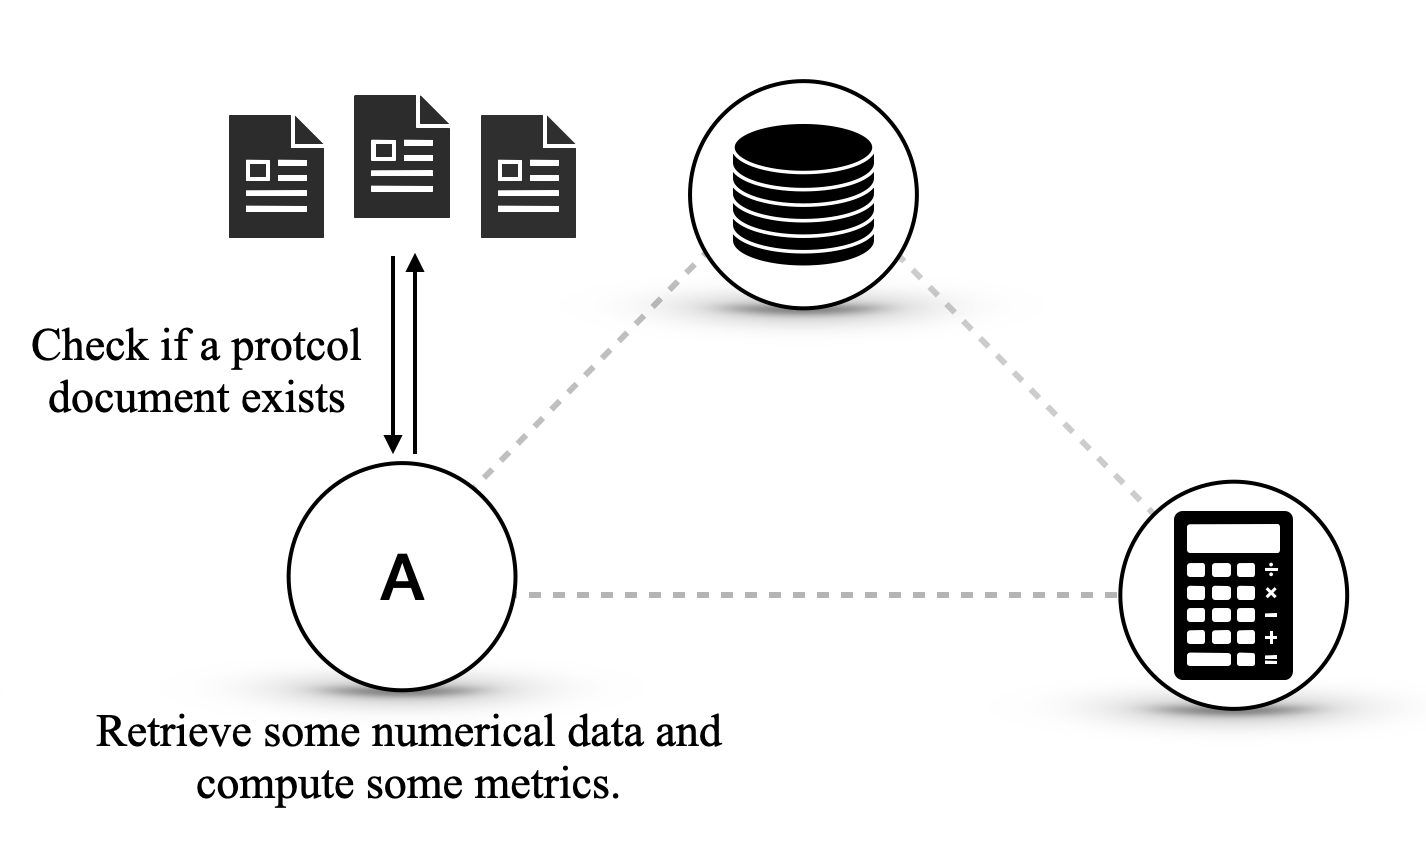
The image is a technical diagram illustrating a workflow or system process. It depicts a central entity (labeled "A") interacting with three other components: a set of documents, a database, and a calculator. The diagram uses icons and directional arrows to show the flow of checks and data retrieval.
### Components/Axes
The diagram is composed of four primary visual elements arranged in a triangular layout with a central node.
1. **Document Icons (Top-Left):**
* **Position:** Located in the upper-left quadrant of the image.
* **Description:** Three identical, dark gray icons representing documents or files. Each icon shows a page with a folded corner and lines suggesting text.
* **Associated Text:** To the left of these icons, the text reads: **"Check if a protocol document exists"**.
2. **Central Node "A" (Center-Left):**
* **Position:** Located in the lower-left quadrant, below the document icons.
* **Description:** A large, white circle with a black outline containing the bold, black capital letter **"A"**.
* **Associated Text:** Below this circle, the text reads: **"Retrieve some numerical data and compute some metrics."**
3. **Database Icon (Top-Right):**
* **Position:** Located in the upper-right quadrant of the image.
* **Description:** A dark gray icon of a stacked disk cylinder, universally representing a database or data storage. It is enclosed within a white circle with a black outline and a subtle drop shadow.
4. **Calculator Icon (Bottom-Right):**
* **Position:** Located in the lower-right quadrant of the image.
* **Description:** A dark gray icon of a calculator with visible buttons (including `÷`, `×`, `-`, `+`, `=`). It is enclosed within a white circle with a black outline and a subtle drop shadow.
### Detailed Analysis
The diagram defines a process flow through explicit connections and implied relationships.
* **Explicit Flow (Solid Arrows):**
* A pair of solid black arrows connects the **Document Icons** and the **Central Node "A"**.
* One arrow points downward from the documents to "A".
* A parallel arrow points upward from "A" to the documents.
* This bidirectional arrow, paired with the text "Check if a protocol document exists," indicates a verification or query process where "A" checks the documents and receives a response.
* **Implicit Relationships (Dashed Lines):**
* A light gray dashed line connects the **Central Node "A"** to the **Database Icon**.
* Another light gray dashed line connects the **Central Node "A"** to the **Calculator Icon**.
* A third light gray dashed line connects the **Database Icon** to the **Calculator Icon**.
* These dashed lines suggest pathways for data flow or logical connections. The text below "A" ("Retrieve some numerical data and compute some metrics") clarifies that "A" retrieves data (implied from the database) and computes metrics (implied using the calculator).
### Key Observations
1. **Central Actor:** The entity labeled "A" is the central orchestrator of the process, initiating checks and data operations.
2. **Process Sequence:** The diagram implies a two-stage process:
* **Stage 1 (Verification):** "A" checks for the existence of a protocol document.
* **Stage 2 (Computation):** Following verification, "A" retrieves numerical data (from the database) and performs computations (using the calculator).
3. **Visual Hierarchy:** The solid arrows and their associated text describe the primary, defined action. The dashed lines and the second block of text describe the subsequent, implied data processing task.
### Interpretation
This diagram models a common technical workflow where a system component ("A") must first validate the presence of a governing protocol or specification before proceeding with data analysis.
* **What it represents:** The diagram illustrates a **conditional data processing pipeline**. The computation of metrics is contingent upon the successful verification of a protocol document. This is a pattern often seen in scientific computing, financial systems, or automated reporting, where calculations must adhere to a defined standard.
* **Relationships:** The connections show "A" as a middleware or controller. It interfaces with a document repository (for rules/specs), a data store (for raw inputs), and a computational engine (for processing). The direct dashed line between the database and calculator suggests that data may flow between them, possibly orchestrated by "A".
* **Notable Implication:** The separation of the "check" (for a document) from the "retrieve and compute" action highlights a design focused on **compliance and reproducibility**. The process ensures that any metrics generated are based on an approved protocol, which is critical for auditability and correctness in technical environments. The diagram does not specify the outcome if a protocol document is *not* found, leaving that logic to the implementation.