## Diagram: Self-Evolution Process
### Overview
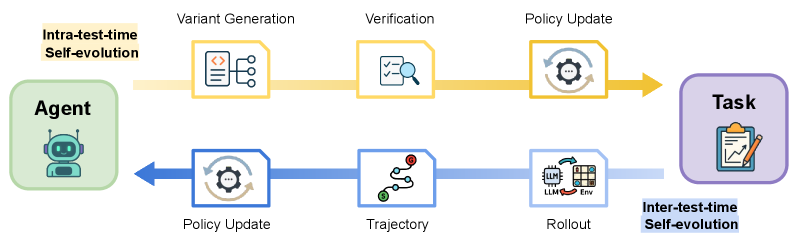
The image illustrates a self-evolution process, likely within a machine learning or AI context. It depicts two distinct self-evolution loops: "Intra-test-time" and "Inter-test-time," each involving different stages of agent interaction, policy updates, and task execution.
### Components/Axes
* **Agent:** A green rounded rectangle on the left, containing a robot icon. Labeled "Agent".
* **Intra-test-time Self-evolution:** Text label above the top process flow.
* **Variant Generation:** A yellow rectangle with a code icon.
* **Verification:** A yellow rectangle with a checklist and magnifying glass icon.
* **Policy Update:** A yellow rectangle with a gear icon and circular arrows.
* **Task:** A purple rounded rectangle on the right, containing a clipboard and pencil icon. Labeled "Task".
* **Inter-test-time Self-evolution:** Text label below the bottom process flow.
* **Policy Update:** A blue rectangle with a gear icon and circular arrows.
* **Trajectory:** A blue rectangle with a trajectory icon (a line with circles).
* **Rollout:** A blue rectangle with an LLM (Large Language Model) and Env (Environment) icon.
* **Arrows:** Yellow arrows connect the top row of components, and blue arrows connect the bottom row of components.
### Detailed Analysis
* **Intra-test-time Self-evolution (Top Row):**
* Starts with the "Agent" (green).
* Flows to "Variant Generation" (yellow) via a yellow arrow.
* Flows to "Verification" (yellow) via a yellow arrow.
* Flows to "Policy Update" (yellow) via a yellow arrow.
* Flows to "Task" (purple) via a yellow arrow.
* **Inter-test-time Self-evolution (Bottom Row):**
* Starts from the "Task" (purple).
* Flows to "Rollout" (blue) via a blue arrow.
* Flows to "Trajectory" (blue) via a blue arrow.
* Flows to "Policy Update" (blue) via a blue arrow.
* Flows back to the "Agent" (green) via a blue arrow.
### Key Observations
* The diagram illustrates a cyclical process with two distinct loops.
* The "Agent" and "Task" are the starting and ending points of the overall process.
* The top row (Intra-test-time) focuses on generating and verifying variants, while the bottom row (Inter-test-time) focuses on rollout and trajectory analysis.
* "Policy Update" appears in both loops, suggesting it's a crucial step in the self-evolution process.
### Interpretation
The diagram represents a self-improving system where an agent interacts with an environment to perform a task. The "Intra-test-time" loop likely involves rapid adjustments and refinements within a single testing session, focusing on generating and validating different approaches. The "Inter-test-time" loop, on the other hand, likely involves learning from the outcomes of multiple testing sessions, refining the agent's policy based on observed trajectories and rollout performance. The LLM and Env components in the "Rollout" stage suggest the agent is interacting with a simulated or real-world environment guided by a large language model. The cyclical nature of the diagram indicates a continuous learning and adaptation process, where the agent's performance improves over time through iterative testing and policy updates.