## Bar Chart: Accuracy Comparison of Qwen2.5 Models
### Overview
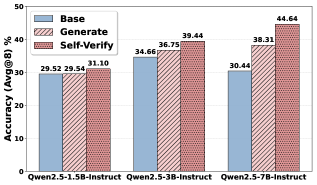
The image is a bar chart comparing the accuracy (Avg@8) of three Qwen2.5 models (1.5B, 3B, and 7B Instruct) under three different conditions: "Base", "Generate", and "Self-Verify". The chart displays the accuracy percentage on the y-axis and the model type on the x-axis.
### Components/Axes
* **Y-axis:** "Accuracy (Avg@8) %", ranging from 0 to 50.
* **X-axis:** Model types: "Qwen2.5-1.5B-Instruct", "Qwen2.5-3B-Instruct", "Qwen2.5-7B-Instruct".
* **Legend:** Located in the top-left corner.
* "Base": Light blue bars.
* "Generate": Red-striped bars.
* "Self-Verify": Darker red-striped bars.
### Detailed Analysis
Here's a breakdown of the accuracy for each model and condition:
* **Qwen2.5-1.5B-Instruct:**
* Base: 29.52%
* Generate: 29.54%
* Self-Verify: 31.10%
* **Qwen2.5-3B-Instruct:**
* Base: 34.66%
* Generate: 36.75%
* Self-Verify: 39.44%
* **Qwen2.5-7B-Instruct:**
* Base: 30.44%
* Generate: 38.31%
* Self-Verify: 44.64%
**Trends:**
* For the 1.5B model, the accuracy is relatively similar across all three conditions.
* For the 3B model, the accuracy increases from "Base" to "Generate" to "Self-Verify".
* For the 7B model, the accuracy shows a significant increase from "Base" to "Generate" to "Self-Verify".
* Across all conditions, the 7B model generally has the highest accuracy, followed by the 3B model, and then the 1.5B model.
### Key Observations
* The "Self-Verify" condition consistently yields the highest accuracy for all models.
* The 7B model shows the most significant improvement in accuracy under the "Self-Verify" condition.
* The 1.5B model shows minimal difference in accuracy between the "Base" and "Generate" conditions.
### Interpretation
The data suggests that the "Self-Verify" method significantly improves the accuracy of the Qwen2.5 models, especially for the larger 7B model. This indicates that the self-verification process is more effective for larger models, potentially due to their increased capacity to reason and refine their outputs. The 1.5B model's relatively stable performance across conditions might suggest that it is less sensitive to the benefits of self-verification, possibly due to its smaller size and limited capacity. The trend indicates that increasing model size and incorporating self-verification techniques can lead to substantial gains in accuracy.