\n
## Bar Chart: Accuracy Comparison of Language Models
### Overview
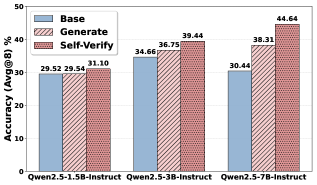
This bar chart compares the accuracy of three different language models (Qwen2.5-1.5B-Instruct, Qwen2.5-3B-Instruct, and Qwen2.5-7B-Instruct) under three different evaluation methods: Base, Generate, and Self-Verify. Accuracy is measured as Avg@8 (Average at 8), likely representing the percentage of times the correct answer is within the top 8 predictions.
### Components/Axes
* **X-axis:** Model Name - Qwen2.5-1.5B-Instruct, Qwen2.5-3B-Instruct, Qwen2.5-7B-Instruct
* **Y-axis:** Accuracy (Avg@8) in percentage, ranging from 0% to 50%.
* **Legend:** Located in the top-left corner.
* **Base:** Represented by a solid blue color.
* **Generate:** Represented by a light red, hatched pattern.
* **Self-Verify:** Represented by a darker red, solid pattern.
### Detailed Analysis
The chart consists of three groups of stacked bars, one for each model. Each group contains three stacked segments representing the Base, Generate, and Self-Verify accuracy scores.
* **Qwen2.5-1.5B-Instruct:**
* Base: Approximately 29.52%
* Generate: Approximately 29.54%
* Self-Verify: Approximately 31.10%
* **Qwen2.5-3B-Instruct:**
* Base: Approximately 34.66%
* Generate: Approximately 36.75%
* Self-Verify: Approximately 39.44%
* **Qwen2.5-7B-Instruct:**
* Base: Approximately 30.44%
* Generate: Approximately 38.31%
* Self-Verify: Approximately 44.64%
The bars are stacked, meaning the total height of each bar represents the combined accuracy across all three methods.
### Key Observations
* Accuracy generally increases with model size (number of parameters). Qwen2.5-7B-Instruct consistently shows the highest accuracy across all three evaluation methods.
* The "Self-Verify" method consistently yields the highest accuracy for each model, suggesting that self-verification is an effective technique for improving performance.
* The difference between "Base" and "Generate" is minimal for the 1.5B model, but becomes more pronounced for the 3B and 7B models.
* The largest improvement comes from applying "Self-Verify" to the 7B model, resulting in a significant increase in accuracy.
### Interpretation
The data suggests that increasing model size and employing self-verification techniques are both effective strategies for improving the accuracy of the Qwen2.5 language models. The consistent outperformance of "Self-Verify" indicates that the model benefits from a process of internally validating its own outputs. The relatively small difference between "Base" and "Generate" for the smallest model suggests that the benefits of generating responses are less pronounced when the model has limited capacity. The 7B model demonstrates the most significant gains from both increased size and self-verification, indicating a synergistic effect. This chart provides evidence supporting the idea that larger models with built-in self-checking mechanisms are more reliable and accurate. The Avg@8 metric suggests that the models are not always providing the *most* accurate answer first, but are able to place it within the top 8 predictions more frequently as model size and verification techniques improve.