## Scatter Plot: elementary_mathematics
### Overview
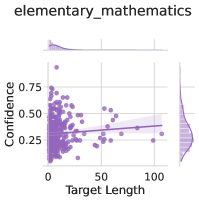
The image is a scatter plot titled "elementary_mathematics". It displays the relationship between "Target Length" on the x-axis and "Confidence" on the y-axis. The plot includes a regression line with a shaded confidence interval, and marginal density plots along both axes. The data points are represented by purple circles.
### Components/Axes
* **Title:** elementary\_mathematics (located at the top)
* **X-axis:**
* Label: Target Length
* Scale: 0 to 100, with tick marks at approximately 0, 50, and 100.
* **Y-axis:**
* Label: Confidence
* Scale: 0 to 0.75, with tick marks at approximately 0, 0.25, 0.50, and 0.75.
* **Data Points:** Purple circles representing individual data points.
* **Regression Line:** A light purple line showing the linear regression fit to the data.
* **Confidence Interval:** A shaded light purple region around the regression line, indicating the uncertainty in the regression estimate.
* **Marginal Density Plots:**
* Top: Density plot of Target Length.
* Right: Density plot of Confidence.
### Detailed Analysis
* **Target Length:** The data points are concentrated between 0 and 50. The density plot shows a high concentration near 0, decreasing as Target Length increases.
* **Confidence:** The data points are spread between 0 and 0.75, with a higher concentration between 0.25 and 0.50. The density plot shows a peak around 0.3.
* **Regression Line:** The regression line has a slight positive slope, indicating a weak positive correlation between Target Length and Confidence.
* **Data Point Distribution:**
* At Target Length = 0, Confidence values range from approximately 0.05 to 0.6.
* At Target Length = 50, Confidence values range from approximately 0.2 to 0.5.
* At Target Length = 100, Confidence values range from approximately 0.3 to 0.4.
### Key Observations
* There is a weak positive correlation between Target Length and Confidence.
* The majority of data points have a Target Length less than 50.
* The Confidence values are mostly concentrated between 0.25 and 0.50.
### Interpretation
The scatter plot suggests that there is a slight tendency for Confidence to increase as Target Length increases, but the correlation is weak. The concentration of data points at lower Target Length values indicates that most observations have shorter target lengths. The distribution of Confidence values suggests that the model's confidence is generally moderate, with a peak around 0.3. The shaded confidence interval around the regression line indicates the uncertainty in the estimated relationship between Target Length and Confidence. The marginal density plots provide additional information about the distribution of each variable.