## Scatter Plot with Marginal Distributions: elementary_mathematics
### Overview
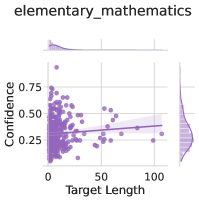
The image is a statistical visualization, specifically a scatter plot with marginal histograms, titled "elementary_mathematics". It displays the relationship between "Target Length" and "Confidence" for a dataset presumably related to elementary mathematics tasks or problems. The plot includes a trend line and distributions for each variable along the axes.
### Components/Axes
* **Main Chart Area:** A scatter plot with data points represented as purple dots.
* **X-Axis:** Labeled "Target Length". The scale runs from 0 to 100, with major tick marks at 0, 50, and 100.
* **Y-Axis:** Labeled "Confidence". The scale runs from 0.25 to 0.75, with major tick marks at 0.25, 0.50, and 0.75.
* **Legend:** Located in the top-left corner of the main chart area. It consists of a small purple square followed by the text "elementary_mathematics".
* **Marginal Distributions:**
* **Top Histogram:** Positioned above the main chart, aligned with the X-axis. It shows the distribution of the "Target Length" variable. The distribution is heavily right-skewed.
* **Right Histogram:** Positioned to the right of the main chart, aligned with the Y-axis. It shows the distribution of the "Confidence" variable. The distribution appears roughly unimodal, centered near 0.5.
* **Trend Line:** A straight, solid purple line is drawn through the scatter plot data.
### Detailed Analysis
* **Data Point Distribution:** The vast majority of data points are clustered in the lower range of the X-axis (Target Length). The highest density appears between Target Length values of approximately 0 to 20. Within this cluster, Confidence values span the full range from ~0.25 to ~0.75, with a concentration around 0.5.
* **Trend Line Analysis:** The purple trend line exhibits a very slight negative slope. It starts at a Confidence value of approximately 0.52 when Target Length is 0 and decreases to approximately 0.48 when Target Length is 100. This indicates a very weak negative correlation between Target Length and Confidence.
* **Marginal Histogram Details:**
* **Target Length (Top):** The histogram shows a sharp peak at the lowest bin (0-~5), with frequency dropping off rapidly as Target Length increases. There are very few data points with a Target Length greater than 50.
* **Confidence (Right):** The histogram shows a central peak around the 0.5 bin. The distribution is relatively symmetric, with fewer instances of very low (<0.3) or very high (>0.7) confidence.
### Key Observations
1. **Strong Right Skew in Target Length:** The dataset is dominated by tasks or problems with short target lengths. Long targets (Length > 50) are rare outliers.
2. **Wide Confidence Spread for Short Targets:** For the most common short targets (Length < 20), confidence varies dramatically, from very low to very high. This suggests that factors other than length are primary drivers of confidence in this domain.
3. **Weak Overall Correlation:** The nearly flat trend line suggests that knowing the Target Length provides very little predictive power for the Confidence score across the entire dataset.
4. **Central Tendency in Confidence:** Despite the wide spread, the marginal distribution and the trend line both indicate that the average or typical confidence level is around 0.5 (50%).
### Interpretation
This visualization suggests that within the context of "elementary_mathematics," the length of a target (e.g., the length of a solution, answer, or problem statement) is not a strong determinant of confidence. The data implies two potential narratives:
1. **Intrinsic Difficulty Variance:** Short problems can be either very easy (high confidence) or deceptively tricky (low confidence), leading to the wide vertical spread on the left side of the plot. The length itself doesn't signal difficulty.
2. **Task Design:** The overwhelming prevalence of short targets indicates the dataset or task domain is fundamentally composed of concise problems. The few long targets do not systematically reduce confidence, as shown by the flat trend, suggesting they may not be inherently more complex but simply different in format.
The key takeaway is that confidence in this elementary mathematics domain is driven by factors orthogonal to target length, such as problem type, required operation, or familiarity. The marginal histograms confirm that any analysis must account for the severe imbalance in target length, as statistical summaries would be dominated by the short-target cluster.