## Scatter Plot: elementary_mathematics
### Overview
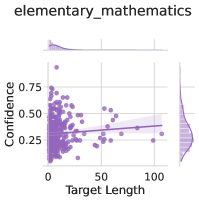
The image is a scatter plot titled "elementary_mathematics" with a marginal histogram on the right. It visualizes the relationship between "Target Length" (x-axis) and "Confidence" (y-axis). A trend line is overlaid on the scatter plot, and the histogram shows the distribution of confidence values.
### Components/Axes
- **Title**: "elementary_mathematics" (top of the plot).
- **X-axis**: Labeled "Target Length" with a scale from 0 to 100.
- **Y-axis**: Labeled "Confidence" with a scale from 0.25 to 0.75.
- **Legend**: Not explicitly labeled, but the trend line is visually distinct (dark purple with a shaded area).
- **Marginal Histogram**: Located on the right side of the plot, showing the distribution of confidence values.
### Detailed Analysis
- **Scatter Plot Data Points**:
- Purple dots are distributed across the plot, with a slight upward trend.
- The trend line (dark purple) slopes upward, indicating a weak positive correlation between Target Length and Confidence.
- The shaded area around the trend line suggests a confidence interval, though the exact bounds are not labeled.
- **Marginal Histogram**:
- The histogram on the right shows a unimodal distribution of confidence values, peaking around 0.5.
- The distribution appears approximately normal, with most values clustered between 0.4 and 0.6.
### Key Observations
- The trend line indicates a **weak positive relationship** between Target Length and Confidence, but the spread of data points suggests significant variability.
- The histogram reveals that **most confidence values are centered around 0.5**, with fewer extreme values (e.g., near 0.25 or 0.75).
- No clear outliers are visible in the scatter plot, though the data points are spread across the entire range of Target Length (0–100).
### Interpretation
The data suggests that while there is a **slight tendency for confidence to increase with target length**, the relationship is not strong. The confidence values are predominantly moderate (around 0.5), implying that factors other than target length may play a more significant role in determining confidence. The weak positive trend could indicate that longer targets are associated with marginally higher confidence, but this effect is not dominant. The histogram’s normal distribution of confidence values further supports the idea that confidence levels are relatively stable across different target lengths.