## Flowchart: Knowledge Graph Question Answering System
### Overview
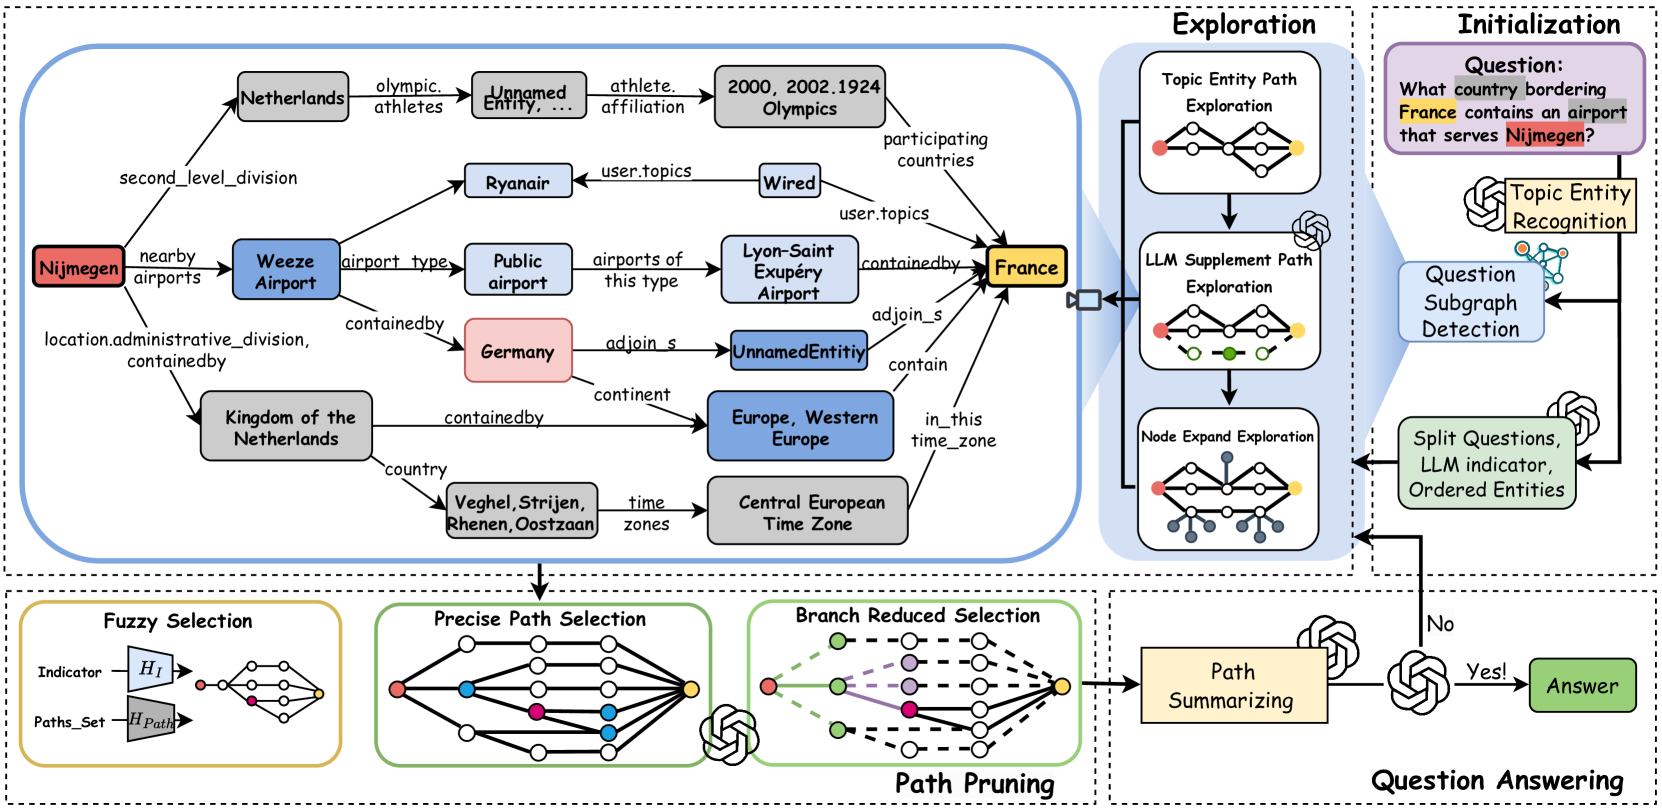
The image depicts a multi-stage flowchart for a knowledge graph-based question answering system. It illustrates the process of extracting answers from structured data through entity recognition, path exploration, and logical inference. The diagram uses color-coded nodes and directional arrows to represent relationships between entities and processes.
### Components/Axes
1. **Legend** (Top-right corner):
- Red: Topic Entity
- Blue: Airport
- Yellow: France
- Gray: Unnamed Entity
- Purple: Time Zone
- Green: Answer
- Orange: Path Summarizing
2. **Main Flowchart Sections**:
- **Initialization** (Left column):
- Topic Entity Recognition
- Question Subgraph Detection
- Split Questions
- LLM Indicator
- Ordered Entities
- **Exploration** (Center):
- Topic Entity Path Exploration
- LLM Supplement Path Exploration
- Node Expand Exploration
- **Question Answering** (Right column):
- Path Summarizing
- Answer (Green node)
3. **Subprocesses**:
- Fuzzy Selection
- Precise Path Selection
- Branch Reduced Selection
- Path Pruning
### Detailed Analysis
1. **Initialization Phase**:
- Starts with a question: "What country bordering France contains an airport that serves Nijmegen?"
- Uses Topic Entity Recognition to identify key entities (France, Nijmegen, airports).
- Detects question subgraphs and splits complex queries into ordered entities.
2. **Exploration Phase**:
- Explores multiple paths through the knowledge graph:
- **Topic Entity Path**: Traverses relationships like "olympic athletes" → "2000 Olympics" → "Netherlands".
- **LLM Supplement Path**: Uses language models to expand node connections (e.g., "Germany" → "Europe").
- **Node Expand Exploration**: Adds contextual relationships (e.g., "Central European Time Zone").
3. **Question Answering Phase**:
- Combines paths through fuzzy selection (broad indicators) and precise path selection (specific routes).
- Prunes irrelevant branches and summarizes valid paths to derive answers.
### Key Observations
1. **Color-Coded Relationships**:
- Red nodes (Topic Entities) form the core of the knowledge graph.
- Blue nodes (Airports) connect to geographic entities (Netherlands, Germany).
- Yellow nodes (France) act as central reference points.
2. **Temporal and Spatial Context**:
- Time zones (gray nodes) and geographic divisions (e.g., "Central European Time Zone") are integrated into the graph.
3. **LLM Integration**:
- Language models are used at multiple stages to expand node relationships and validate paths.
### Interpretation
This flowchart represents a hybrid system combining structured knowledge graphs with LLM capabilities. The process begins with precise entity recognition, then explores multiple logical paths through the graph using both rule-based and AI-driven methods. The final answer emerges from synthesizing validated paths, demonstrating how structured data and AI can collaborate to answer complex geographical queries. The use of color coding and directional flow emphasizes the systematic traversal of relationships, while the inclusion of time zones and administrative divisions highlights the system's ability to handle multi-dimensional data.