# Technical Document Extraction: Clinical Diagnostic Workflow Diagram
## 1. Component Identification & Spatial Grounding
### Header Section
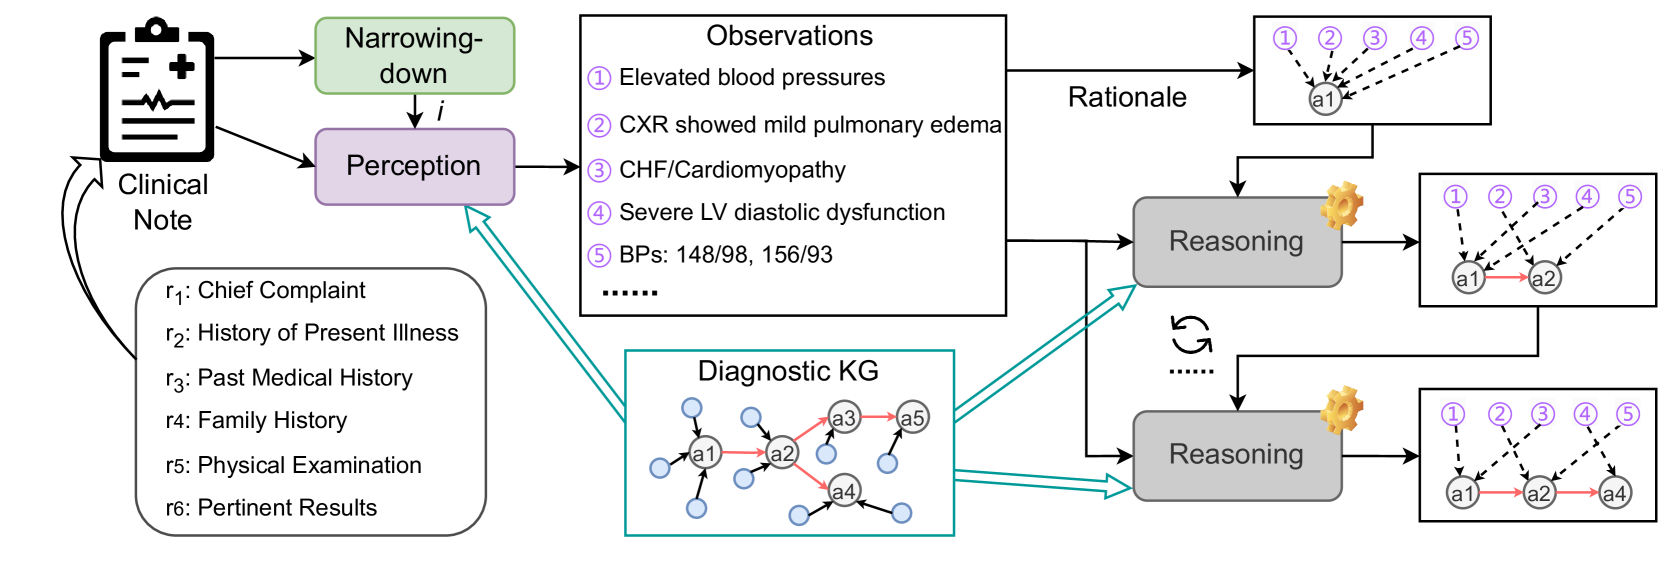
- **Clinical Note** (Top-left)
- Icon: Medical clipboard with EKG waveform
- Text: "Clinical Note" with bidirectional arrow
- Sub-components:
- `r1`: Chief Complaint
- `r2`: History of Present Illness
- `r3`: Past Medical History
- `r4`: Family History
- `r5`: Physical Examination
- `r6`: Pertinent Results
### Main Workflow
- **Narrowing-down** (Green box, top-center)
- Arrow from Clinical Note to Perception
- **Perception** (Purple box, center-left)
- Arrow from Narrowing-down to Observations
- **Observations** (White box, center)
- Listed findings:
1. Elevated blood pressures
2. CXR showed mild pulmonary edema
3. CHF/Cardiomyopathy
4. Severe LV diastolic dysfunction
5. BPs: 148/98, 156/93
- Arrow to Rationales (Top-right)
- **Rationale** (White box, top-right)
- Nodes: `a1` (central), `a2-a5` (peripheral)
- Connections: Dashed lines between all nodes
- **Diagnostic KG** (Central network)
- Nodes: `a1-a5` (blue circles)
- Connections:
- `a1` ↔ `a2` (red)
- `a1` ↔ `a3` (blue)
- `a1` ↔ `a4` (green)
- `a1` ↔ `a5` (yellow)
- `a2` ↔ `a3` (red)
- `a3` ↔ `a4` (blue)
- `a4` ↔ `a5` (yellow)
- **Reasoning** (Gray box, bottom-right)
- Two identical boxes with gear icon
- Arrows between boxes (bidirectional)
- Connections to Diagnostic KG and Rationale
## 2. Flowchart Analysis
### Primary Pathway
1. Clinical Note → Narrowing-down → Perception → Observations → Rationales
2. Observations → Diagnostic KG (bidirectional)
3. Rationales → Reasoning (two stages)
4. Reasoning → Diagnostic KG (feedback loop)
### Secondary Pathways
- Diagnostic KG nodes (`a1-a5`) connect to:
- All Rationale nodes (`a1-a5`)
- Both Reasoning stages
- Rationale nodes show hierarchical connections:
- `a1` as central hub
- `a2-a5` as peripheral nodes
## 3. Key Observations
1. **Medical Findings** (Observations box):
- All findings marked with purple bullet points
- Blood pressure readings show progressive increase (148/98 → 156/93)
- CHF/Cardiomyopathy and Severe LV diastolic dysfunction indicate cardiac involvement
2. **Diagnostic Knowledge Graph**:
- Central node `a1` connects to all other nodes
- Color-coded connections suggest different diagnostic relationships:
- Red: Strong association
- Blue: Moderate association
- Green/Yellow: Weak association
3. **Reasoning Process**:
- Two identical reasoning stages suggest iterative analysis
- Gear icon implies algorithmic processing
- Feedback loop between Reasoning and Diagnostic KG indicates dynamic updating
## 4. Data Structure Summary
### Clinical Note Components
| Component | Description |
|-----------|-------------|
| r1 | Chief Complaint |
| r2 | History of Present Illness |
| r3 | Past Medical History |
| r4 | Family History |
| r5 | Physical Examination |
| r6 | Pertinent Results |
### Observations
1. Elevated blood pressures
2. CXR: Mild pulmonary edema
3. CHF/Cardiomyopathy
4. Severe LV diastolic dysfunction
5. BP readings: 148/98, 156/93
### Diagnostic KG Connections
- `a1` (central) connects to all nodes
- Secondary connections:
- `a2` ↔ `a3` (red)
- `a3` ↔ `a4` (blue)
- `a4` ↔ `a5` (yellow)
## 5. Workflow Logic
1. Clinical data (r1-r6) feeds into narrowing-down process
2. Perception transforms data into medical observations
3. Observations inform both:
- Rationales (hypothesis generation)
- Diagnostic KG (knowledge integration)
4. Rationales and KG feed into dual reasoning stages
5. Final reasoning output connects back to KG for validation
## 6. Technical Notes
- All text in English
- No numerical data beyond blood pressure readings
- Diagram uses color coding for connection types:
- Red: Strong association
- Blue: Moderate association
- Green/Yellow: Weak association
- No legend present for color coding
- All arrows indicate bidirectional relationships except:
- Clinical Note → Narrowing-down (unidirectional)
- Narrowing-down → Perception (unidirectional)