# Technical Document Extraction: Cosine Similarity across Model Layers
## 1. Image Overview
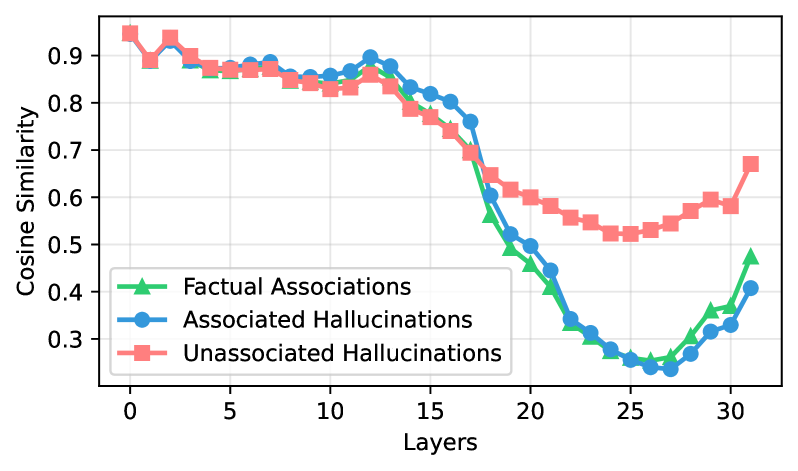
This image is a line graph illustrating the relationship between model depth (Layers) and the Cosine Similarity of three distinct data categories. The chart uses a grid background for precise value estimation.
## 2. Component Isolation
### A. Header/Axes
* **Y-Axis Label:** Cosine Similarity (Vertical, left side).
* **Y-Axis Markers:** 0.3, 0.4, 0.5, 0.6, 0.7, 0.8, 0.9.
* **X-Axis Label:** Layers (Horizontal, bottom center).
* **X-Axis Markers:** 0, 5, 10, 15, 20, 25, 30.
### B. Legend (Spatial Grounding: Bottom-Left [x≈0.1, y≈0.2])
The legend identifies three data series:
1. **Factual Associations:** Green line with triangle markers ($\triangle$).
2. **Associated Hallucinations:** Blue line with circle markers ($\bigcirc$).
3. **Unassociated Hallucinations:** Pink/Light Red line with square markers ($\square$).
---
## 3. Data Series Analysis and Trend Verification
### Series 1: Factual Associations (Green, Triangles)
* **Trend:** Starts high (~0.95), remains relatively stable with a slight downward drift until Layer 15. It then experiences a sharp, steep decline reaching a nadir at Layer 25, followed by a moderate recovery in the final layers.
* **Key Data Points:**
* Layer 0: ~0.95
* Layer 15: ~0.78
* Layer 25: ~0.26 (Minimum)
* Layer 31: ~0.48
### Series 2: Associated Hallucinations (Blue, Circles)
* **Trend:** Closely tracks the "Factual Associations" series for the first 15 layers. Between Layers 15 and 20, it maintains a slightly higher similarity than the factual series before following the same sharp decline. It reaches the lowest absolute similarity of all three groups around Layer 27.
* **Key Data Points:**
* Layer 0: ~0.95
* Layer 12: ~0.90 (Local peak)
* Layer 27: ~0.24 (Absolute Minimum)
* Layer 31: ~0.41
### Series 3: Unassociated Hallucinations (Pink, Squares)
* **Trend:** Starts at the same high point (~0.95). While it follows the general downward trend of the other two, its decline is significantly less severe. After Layer 17, it diverges upward from the other two series, maintaining a much higher cosine similarity through the middle and late layers.
* **Key Data Points:**
* Layer 0: ~0.95
* Layer 17: ~0.70
* Layer 25: ~0.52 (Minimum)
* Layer 31: ~0.68
---
## 4. Comparative Observations
* **Initial Convergence:** All three categories begin with nearly identical cosine similarity (~0.95) at Layer 0 and stay tightly clustered until approximately Layer 13.
* **The Divergence Point:** Significant divergence occurs after Layer 15.
* **The "U-Shape" Phenomenon:** All three series exhibit a "U-shaped" curve, where similarity drops in the middle-to-late layers (20-27) and begins to rise again toward the final layer (31).
* **Separation of Hallucinations:** "Unassociated Hallucinations" maintain a consistently higher similarity in the later layers (Layers 20-31) compared to both "Factual Associations" and "Associated Hallucinations." The "Associated Hallucinations" and "Factual Associations" remain closely coupled throughout the entire model depth.